Let's say I have this dataframe df:
df <- structure(list(Fruit = c("Apple", "Orange", "Graphe", "Apple",
"Orange", "Graphe", "Apple", "Orange", "Graphe", "Apple", "Orange",
"Graphe", "Apple", "Orange", "Graphe", "Apple", "Orange", "Graphe",
"Apple", "Orange", "Graphe", "Apple", "Orange", "Graphe", "Apple",
"Orange", "Graphe", "Apple", "Orange", "Graphe"), value1 = c(9L,
27L, 21L, 13L, 30L, 8L, 29L, 24L, 25L, 10L, 20L, 5L, 1L, 28L,
11L, 3L, 4L, 12L, 26L, 14L, 19L, 16L, 6L, 17L, 23L, 7L, 18L,
22L, 15L, 2L), value2 = c(11L, 6L, 1L, 30L, 2L, 12L, 20L, 27L,
3L, 10L, 26L, 4L, 7L, 8L, 15L, 5L, 17L, 21L, 18L, 9L, 19L, 16L,
24L, 14L, 23L, 22L, 29L, 13L, 25L, 28L), Var = c("A", "A", "A",
"A", "B", "B", "B", "B", "B", "B", "A", "B", "B", "A", "A", "A",
"B", "B", "A", "A", "A", "B", "B", "A", "B", "A", "B", "A", "A",
"A")), class = "data.frame", row.names = c(NA, -30L))
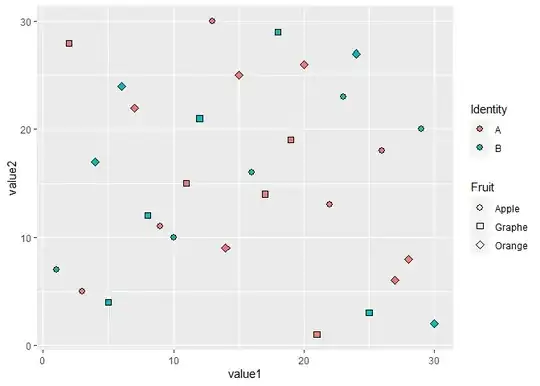
I want to display it with geom_point, with fill on Var and shape on Fruit like this:
library(ggplot2)

ggplot(df, aes(value1, value2, fill = Var, shape = Fruit)) +
  geom_point(color = "black", size = 2.5) +
  scale_shape_manual(values = 21:23) +
  guides(fill = guide_legend("Identity", override.aes = list(shape = 21)))
I understand that we can override the shape in the figure legend (like in my code), but is it possible to have the fill legend shown as a smear/smudge shape like the following (replace the filled circle with the following smear shapes)? To my understanding, that's no such pre-defined smear/smudge shape in ggplot.
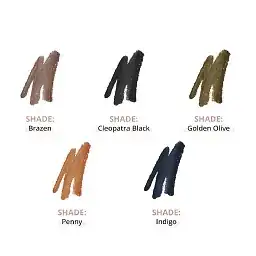
I also looked at the key_glyph parameter but I'm not sure if we can achieve that via custom functions.