0

I'm looking to have the following plot separately positioned by Group, on each level of values of Species:


set.seed(101); x <- cbind( iris, Group = sample(LETTERS[1:3],size=nrow(iris),replace=TRUE))
ggplot(x) + geom_col( aes(x=Species,y=Sepal.Width, fill=Group), col=1)

I added an crude illustration of what I want to achieve with the first Species, in the picture below:

amateurish illustration

Sirius
  • 5,224
  • 2
  • 14
  • 21
  • 2
    It seems that you just need to add `position = position_dodge()` inside `geom_col`? – Bastián Olea Herrera Aug 17 '23 at 14:16
  • To me if I do that, the y value is way off, from expected around 50, as shown in my hackish figure, down to only around 4. I suspect all individual elements, every single red, blue and green brick from each stack, are then positioned in front of each other. – Sirius Aug 17 '23 at 14:18
  • 2
    This seems a dupe of https://stackoverflow.com/q/12715635/3358272, are you open to faceting? Something like `ggplot(x) + geom_col( aes(x=Group, y=Sepal.Width, fill=Group), color=1) + facet_grid(~ Species, switch = "both") + labs(x = "Species / Group")` – r2evans Aug 17 '23 at 14:20
  • Worst case I'd have to resort to that. I was mainly surprised that something conceptually quite simple turned out to be so hard. – Sirius Aug 17 '23 at 14:23
  • 1
    Add `width=1.5` to your geom_col for a ... surprisingly bad rendition – r2evans Aug 17 '23 at 14:24

1 Answers1

4

As already suggested by @r2evans in his comment one option to fake dodging and stacking in the same chart would be to use the "facets that do not look like facets" trick, which means to facet by Species and to map Group on x. Additionally, to achieve the overlap of the stacked bars for the three groups one could set the width of the bars to a value > 1, which also requires to adjust the limits (which I do via coord_cartesian) and to arrange your data by Group. Finally, we have to do some adjustments via theme() to get rid of the facet look.

set.seed(101)

x <- cbind(iris,
  Group = sample(LETTERS[1:3], size = nrow(iris), replace = TRUE)
)

library(ggplot2)
library(dplyr, warn = FALSE)

x |>
  dplyr::arrange(Species, Group) |>
  ggplot() +
  geom_col(
    aes(x = Group, y = Sepal.Width, fill = Group),
    col = 1, width = 1.5
  ) +
  scale_x_discrete(breaks = "B") +
  facet_wrap(~Species, scales = "free_x", strip.position = "bottom") +
  coord_cartesian(xlim = c(.55, 3.45)) +
  theme(
    axis.text.x = element_blank(),
    strip.background.x = element_blank(),
    panel.spacing.x = unit(0, "pt"),
    strip.placement = "outside"
  ) +
  labs(x = NULL)
#> Warning: `position_stack()` requires non-overlapping x intervals
#> `position_stack()` requires non-overlapping x intervals
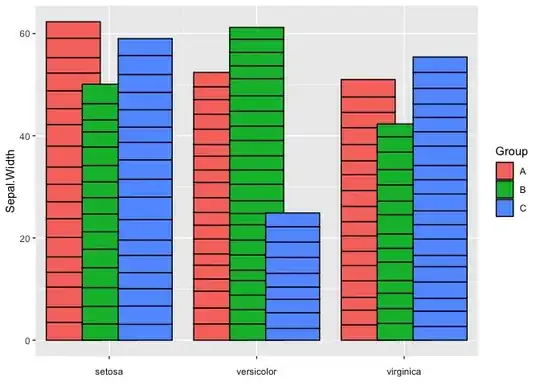

stefan
  • 90,330
  • 6
  • 25
  • 51