This is what I want:
gg <- ggplot(mpg,aes(displ,cty,color=as.factor(cyl))) + geom_point() +
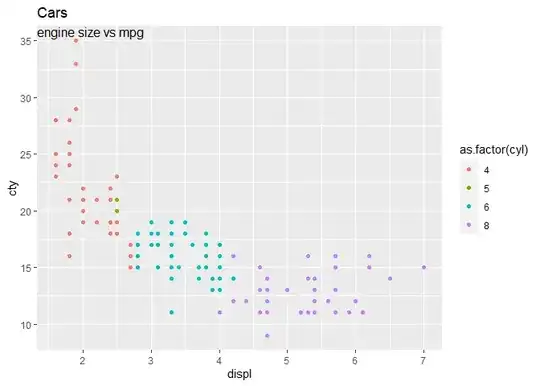
labs(title = "Cars",subtitle= "engine size vs mpg") +
theme(plot.subtitle = element_text(vjust=-7,hjust = .01),
plot.title = element_text(vjust=-5))
gg
 It pushes the titles down such that the subtitle is just within the plot panel.
I would like to "pre-bake" a parameter-less theme_nudge() function that intelligently decides on the vjust parameter. This requires understanding of the plot panel range. I can extract the range from the gg object AFTER it's rendered (extract plot range from ggplot object) but I want to do it on the fly. It would then look like this:
theme_nudge <- function(...){
   #probably something like
   my_vjust <- -(computed_range_y * .1)
   ggplot2::theme(plot.subtitle = element_text(vjust=my_vjust,hjust=.1),
                  plot.title = element_text(vjust=my_vjust*.7),
                  ...)
}

gg <- ggplot(mpg,aes(displ,cty,color=as.factor(cyl))) + geom_point() +
   labs(title = "Cars",subtitle= "engine size vs mpg") +
   theme_nudge()
What is computed_range_y? Is that possible? Thanks.