0

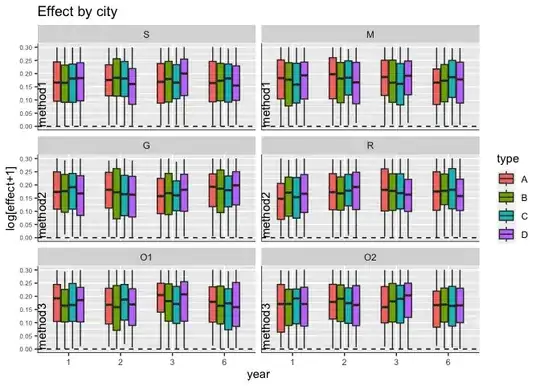
I have a dataset for 6 sites (cities) and two sites each are in another category called 'method'. I want to make graphs of each site using facet_wrap in two columns (3 rows corresponding to each method) and add the method name as a vertical label on each of the three rows. I want the site name as a horizontal label in each facet.

I can't use facet_grid because that labels columns and/or rows, but not individual facets and it creates a 2x6 pattern instead of a 3x2 pattern. Is there a way to use facet_wrap and add vertical labels using a categorical variable? I realize I can add the site name as text for each graph, but I would prefer to use labels, especially because of placement issues and the bar plots.

The data look like this:

    ggplot(effect, aes(x=year, y= log10(effect+1), fill=type))+
    geom_boxplot(width=0.6)+
    facet_wrap(~factor(city_f, levels=c('S','M','G','R','O1','O2')), ncol = 2, labeller =             as_labeller(new_labels2))+ 
    scale_y_continuous(n.breaks = 8)+
    theme(axis.text.x = element_text(size = 8), axis.text.y = element_text(size = 6))+
    labs(x="year", y="log[effect+1]", title="Effect by city")+
    geom_hline(yintercept=0,linetype="dashed")+ 
    geom_hline(aes(yintercept=-Inf)) + 
    geom_vline(aes(xintercept=-Inf))

This the result:

The sites are already in the correct rows to match the method variable.

I tried

facet_wrap(method~factor(city_f....

and

facet_grid(method~factor(city_f....
sueb2
  • 1
  • 2
  • 2
    Welcome to SO! To add labels I would suggest to use a `geom_text`. For more help please provide [a minimal reproducible example](https://stackoverflow.com/questions/5963269/how-to-make-a-great-r-reproducible-example) including a snippet of your data or some fake data. – stefan Aug 22 '23 at 23:29
  • Thank you stefan. I could not figure out how to make geom_text or geom_label fit a label at the end of the row in a box (aesthetically like the vertical labels in facet_wrap) and how to match the label with the correct row. Also, I was unsure how to provide a snippet of my large dataset, but I pasted a sample above - apologies for that. – sueb2 Aug 23 '23 at 03:16
  • Please do not post an image of code/data/errors [for these reasons](https://meta.stackoverflow.com/questions/285551/why-not-upload-images-of-code-errors-when-asking-a-question/285557#285557). Just include the code, console output, or data (e.g., dput(head(x)) or data.frame(...)) directly. You could e.g. run `dput(head(effect, 10))` and copy the output into your post. Or if your dataset is "complicated" then some fake data is often preferable. See my answer for an example on how this could be achieved. – stefan Aug 23 '23 at 06:18

1 Answers1

0

One option would be to create a dataframe containing the unique values for your facetting variable and the corresponding method label, which could e.g. achieved using dplyr::distinct. This dataset can then be passed to a geom_text to add the labels per facet where of course we have to set the position for the labels. In the code below I placed them at the left boundary of the facet panels.

Using some random fake example data:

# Create some fake example data
set.seed(123)

effect <- expand.grid(
  year = factor(rep(c(1:3, 6), each = 100)),
  type = LETTERS[1:4],
  city_f = c("S", "M", "G", "R", "O1", "O2")
)
effect$effect <- runif(nrow(effect))
effect$method <- dplyr::case_match(
  effect$city_f,
  c("S", "M") ~ "method1",
  c("G", "R") ~ "method2",
  .default = "method3"
)

library(ggplot2)
library(dplyr, warn = FALSE)

effect_labels <- effect |>
  dplyr::distinct(
    city_f, method
  )
effect$city_f <- factor(effect$city_f,
  levels = c("S", "M", "G", "R", "O1", "O2")
)

ggplot(effect, aes(x = year, y = log10(effect + 1))) +
  geom_boxplot(aes(fill = type), width = 0.6) +
  geom_text(
    data = effect_labels,
    aes(x = -Inf, y = 0, label = method),
    hjust = 0,
    vjust = 1,
    angle = 90
  ) +
  facet_wrap(~city_f, ncol = 2) +
  scale_y_continuous(n.breaks = 8) +
  theme(axis.text.x = element_text(size = 8), axis.text.y = element_text(size = 6)) +
  labs(x = "year", y = "log[effect+1]", title = "Effect by city") +
  geom_hline(yintercept = 0, linetype = "dashed") +
  geom_hline(aes(yintercept = -Inf)) +
  geom_vline(aes(xintercept = -Inf))

stefan
  • 90,330
  • 6
  • 25
  • 51
  • Thank you! I was able to place one label per row (as I wanted) when I left the method values for the sites on the lhs as blank in the label df. I used this code to place the labels on the rhs: geom_text(data = method_labels, aes(x=Inf, y=0, label = method), hjust=0.5, vjust=1, angle = 270). Now I just need to adjust the font and frame the label! – sueb2 Aug 23 '23 at 19:51
  • You could set the font via the `family=` argument. A frame is not that easy to achieve. You can add a frame by switching to `geom_label`. But at present it does not allow to rotate the label. But that will soon be implemented (but requires to install the dev version of ggplot2 from GitHub). In the meanwhile you could go for `ggtext::geom_richtext`. – stefan Aug 23 '23 at 19:55