0

The azure web app is a data api that is accessed by my VueJS frontend which is a static web app.

All of a sudden on Aug 2nd the DataIn metric shows large amounts of data inbound (image). I'm quite certain it isn't coming from the VueJS frontend.

enter image description here

What else can be causing this? What does Data In cover? Does it cover data pulled from an azure SQl Database?
Could it be when Azure Application Insights Profiler collects data? (although I expect that would be included as 'Data Out')

Both the web app and its SQL Db are in the same Azure location.

I turned on Application Insights over the last few weeks and expected to see some unexpected HTTP Requests but it doesn't show anything out of the ordinary. For instance I just checked it again now and it shows 800MB inbound, but there were only 100 x PATCH Http Requests and I know that each of those are only a few KB in size.

AppyAndy
  • 53
  • 1
  • 5

1 Answers1

0

"Data In" generally refers to the incoming or input data that is received by a system from various sources. This can include user-generated data, API requests, sensor readings, database queries, and more.

I turned on Application Insights over the last few weeks and expected to see some unexpected HTTP Requests but it doesn't show anything out of the ordinary.

  • Application Insights collects different types of telemetry data, including request telemetry, dependency telemetry (tracking calls to external services like databases), exception telemetry, and custom events. The reported data might not solely be related to the HTTP requests.

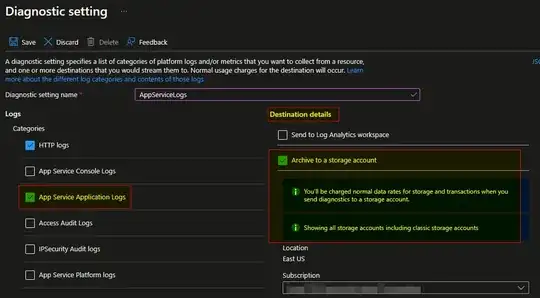
  • Navigate to your Azure Web, go to Monitoring > Diagnostic settings > Add diagnostic setting and select Categories.

enter image description here

  • Check incoming requests, responses, errors, and unusual traffic patterns in the application with the KQL queries. Go to Monitoring>logs.
AppServiceAppLogs
| project timestamp, level, message, customDimensions["requestId"], customDimensions["requestUrl"], customDimensions["responseCode"], customDimensions["duration"], customDimensions["exception"]
| extend isErrorResponse = iif(customDimensions["responseCode"] >= 400, true, false)
| where level == "Information" and customDimensions["requestUrl"] != ""
| project timestamp, requestId = tostring(customDimensions["requestId"]), requestUrl = tostring(customDimensions["requestUrl"]), responseCode = toint(customDimensions["responseCode"]), duration = totimespan(customDimensions["duration"]), isErrorResponse, exception = tostring(customDimensions["exception"])
| order by timestamp desc

Sometimes, unexpected spikes in traffic can be caused by bots or unauthorized access attempts. These requests can result in a higher "Data In" metric.

Suresh Chikkam
  • 623
  • 2
  • 2
  • 6