Hello I am using this package I found very handy
So this is the data:
df <- data.frame(
  x = LETTERS[1:16],
  group = rep(c("Group 1", "Group 2", "Group 3"), c(5, 3, 8)),
  value = rpois(16, 10)
)
And this is the code:
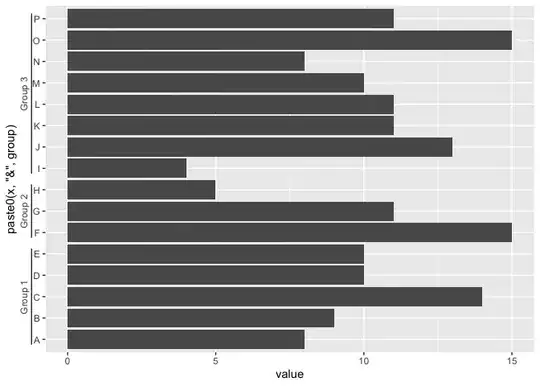
ggplot(df, aes(paste0(x, "&", group), value)) +
  geom_col() +
  guides(y = ggh4x::guide_axis_nested(delim = "&")) + coord_flip
This produces this plot:

How can I change the group labels (Group 1, Group 2, and Group 3) to be rotated 90 degrees to the left? Just the group labels.