0

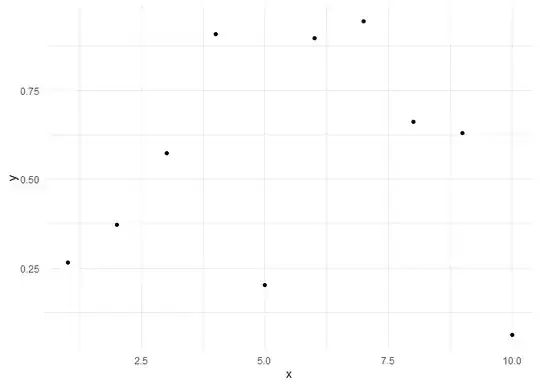
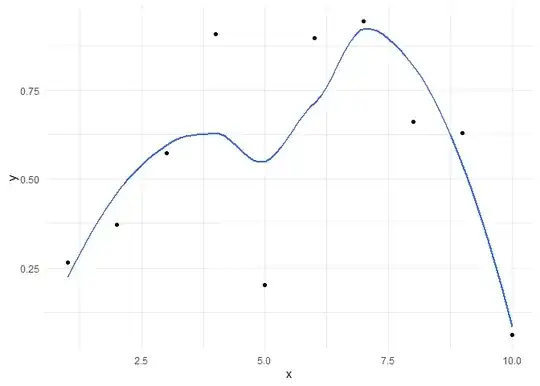
I have a relatively small dataset of simulated data. I want to fit a lowess trendline to a plot, but have noticed that the geom_smooth() line does not always go exactly through the actual datapoints. This is a problem for me, as I want the graphic to represent the data as closely as possible.

Is there a way to make R do this?

Separately (but related), can I set external constraints on the trendline, for example to make it not exceed a certain value, etc.?

swediot
  • 19
  • 4

1 Answers1

2

It is possible to do this quite easily nowadays with ggplot extension packages.

In the absence of sample data, we need to assume that you only have one y value per x value, otherwise it won't be possible to have a smooth curve through each point. Let's create a simple dataset:

library(ggplot2)

set.seed(1)

df <- data.frame(x = 1:10, y = runif(10)) 

We can plot these points as follows:

p <- ggplot(df, aes(x, y)) +
  geom_point() +
  theme_minimal()

p

A standard loess smooth through these points will look like this:

p + geom_smooth(se = FALSE)

But if we wish all the points to be joined up, we can use something like the geom_xspline function from ggalt:

p + ggalt::geom_xspline(spline_shape = -0.4, alpha = 0.3)

Created on 2023-08-28 with reprex v2.0.2

Allan Cameron
  • 147,086
  • 7
  • 49
  • 87
  • 2
    Allan, would you consider posting to the dupe target? I will upvote it there too :) – M-- Aug 28 '23 at 13:13
  • @M-- the dupe target requires a different answer using the OP's data, but I have posted essentially the same solution there so it is more easily found. Please don't feel compelled to upvote it though. – Allan Cameron Aug 28 '23 at 13:19