If I have the following plot
library(ggplot2)
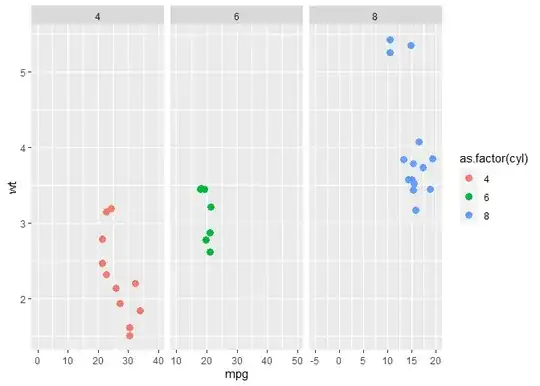
ggplot(mtcars, aes(x=mpg, y=wt, color=as.factor(cyl))) +
geom_point(size=3) +
facet_wrap(~cyl)

Created on 2023-08-30 with reprex v2.0.2
how can I set the limits of the x axis of each subplot individually?
I.e.
- 4: from 0 to 40
- 6: from 10 to 50
- 8: from -5 to 20
Thank you very much! (Note: not sure if that question was already asked, but I could not find anything that shows this specific use case)
EDIT regarding marking as duplicate: The question that the duplicate remark refers to is one possible answer, however the accepted answer is a much nicer solution.