How can i convert the axis coordinates into pixel coordinates? I have a set of data which include the negative and floating values, i need to put all of the data into the image. But the pixel coordinates are all positive integer. how to solve the negative issue?
Asked
Active
Viewed 1.1k times
3
-
What kind of plot do you need to generate? Scatter, line, etc. Also, what form is your data in? X and & vectors, Nx2 matrix, etc. – reve_etrange Oct 11 '11 at 04:11
-
The sets of data [X,Y] are the points coordinates that can make up ellipse.I can plot the ellipse out,but for now, i'm facing the difficulty in putting all the coordinates into image(pixels coordinates).I'm supposed to draw ellipse in image. – Elsie Oct 11 '11 at 04:30
-
@Ivy: I posted an answer based on your comment.. – Amro Oct 14 '11 at 06:18
2 Answers
4
From what I understand, you have a set of points representing an ellipse, and you would to draw them directly inside an image matrix (not just display them on screen).
For this, you can use the POLY2MASK function to convert the ellipse into a binary mask. Then by computing its perimeter, this will give us a binary mask representing only the pixels that constitute the ellipse, which is applied to the image to set the color of the pixels.
Consider the example below. I am using the function calculateEllipse.m from a previous question here on SO:
%# some image
I = imread('pout.tif');
sz = size(I);
%# ellipse we would like to draw directly on image matrix
[x,y] = calculateEllipse(100,50, 150,50, 30, 100);
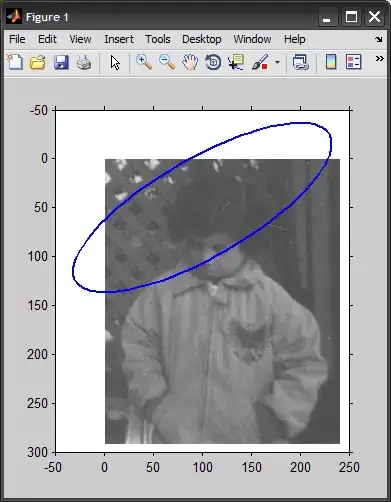
%# lets show the image, and plot the ellipse (overlayed).
%# note how ellipse have floating point coordinates,
%# and also have points outside the image boundary
figure, imshow(I)
hold on, plot(x,y, 'LineWidth',2)
axis([-50 250 -50 300]), axis on
%# create mask for image pixels inside the ellipse polygon
BW = poly2mask(x,y,sz(1),sz(2));
%# get the perimter of this mask
BW = bwperim(BW,8);
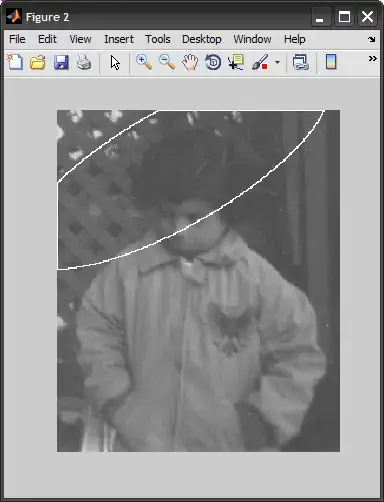
%# use the mask to index into image
II = I;
II(BW) = 255;
figure, imshow(II)
This should give you superior results to simply rounding the coordinates of x and y (plus it handles out-of-boundary points for us). Make sure to read the algorithm section of POLY2MASK to see how it works on a subpixel level.
EDIT:
if you are working with an RGB image (3D matrix), the same applies, you only need to change the last part where we use the binary mask :
%# color of the ellipse (red)
clr = [255 0 0];                %# assuming UINT8 image data type

%# use the mask to index into image
II = I;
z = false(size(BW));
II( cat(3,BW,z,z) ) = clr(1);   %# R channel
II( cat(3,z,BW,z) ) = clr(2);   %# G channel
II( cat(3,z,z,BW) ) = clr(3);   %# B channel
figure, imshow(II)
Here is yet another way:
%# use the mask to index into image
II = I;
BW_ind = bsxfun(@plus, find(BW), prod(sz(1:2)).*(0:2));
II(BW_ind) = repmat(clr, [size(BW_ind,1) 1]);
figure, imshow(II)
-
How can i modify the above 'BW' to control the color of perimter of the mask, i intend to use the RGB value. – Elsie Oct 20 '11 at 05:34
-
@Ivy: it is just a matter of indexing, see my edit above (one using logical indexing, the other linear indices) – Amro Oct 20 '11 at 06:38
3
You can pass vectors of coordinates to scatter.
x = [-1.2 -2.4 0.3 7];
y = [2    -1   1  -3];
scatter(x,y,'.');
If you need the image matrix,
h = figure();
scatter(x,y);
F = getframe(h);
img = F.cdata;
You can also use print to save the plot to a file (or simply export from figure window), then use imread to read the file.
There is also this set of m-files from the File Exchange, which are already very close to what you need.
Finally, here is a simple way to get what you want, within a specified precision:
precision = 10;        %# multiple of 10
mi = min(min(x),min(y));
x = x - mi;        %# subtract minimum to get rid of negative numbers
y = y - mi;
x = round(x*precision) + 1;    %# "move" decimal point, round to integer,
y = round(y*precision) + 1;    %# add 1 to index from 1
img = zeros(max(max(x),max(y)));    %# image will be square, doesn't have to be
x = uint32(x);
y = uint32(y);
ind = sub2ind(size(img),y,x);    %# use x,y or reverse arrays to flip image
img(ind) = 1;    %# could set intensity or RGB values in a loop instead
The "precision" parameter determines how many decimal places of the floating point values will be kept, and thus the resolution and accuracy of the image. The cast to uint32 might be unnecessary.
If you have a Nx3 matrix of RGB values for each of N points:
img = zeros(max(max(x),max(y)),max(max(x),max(y)),3);
for i=1:length(N)        %# N = length(x) = length(y)
    img(x(i),y(i),:) = rgb(i,:);
end
reve_etrange
- 2,561
- 1
- 22
- 36
-
-
I've tested out my ellipse using the above codes.But i don't undertand 'round(x*precision) + 1'. What does this code do? What's the '+1'? Is it some kind of conversion? – Elsie Oct 11 '11 at 08:35
-
After subtracting the minimum, the new minimum is zero. Once we're ready to use `x` and `y` as indices, we need to add `1` since MATLAB indexes from `1`. – reve_etrange Oct 11 '11 at 08:41
-
I commented the code block, hopefully it's more clear. Find-replace the hash characters if necessary. – reve_etrange Oct 11 '11 at 08:53