2

I have a StackedXYAreaChart similar to the one below:

enter image description here

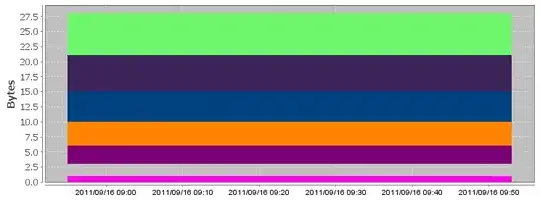
On the Y-axis, instead of the tick units shown (2.5, 5.0, 7.5, 10.0, etc.), I have the following: 100,000, 200,000, 300,000, 400,000, etc. These represent Bytes, just like the one above. My question is: is there a way I could format these tick units such that they represent Kilobytes, i.e. 100, 200, 300, 400, etc. or even Megabytes, i.e. 0.1, 0.2, 0.3, 0.4, etc.? I don't want to display 10 MB as 10,000,000 on the Y-axis.

Thanks!

BJ Dela Cruz
  • 5,194
  • 13
  • 51
  • 84

2 Answers2

4

The static factory createStackedAreaChart() instatiates a NumberAxis for the range. The NumberAxis method createStandardTickUnits() creates the standard tick units, which may serve as an example for creating your own units. In particular, "If you don't like these defaults, create your own instance of TickUnits and then pass it to the setStandardTickUnits() method." There's more details here.

Community
  • 1
  • 1
trashgod
  • 203,806
  • 29
  • 246
  • 1,045
  • 1
    I subclassed `NumberTickUnit`, overwrote the `valueToString` method, used my own formatter in the `valueToString` method, and then added my custom tick unit to `TickUnits`; and it worked! Thanks again! – BJ Dela Cruz Oct 12 '11 at 01:48
1

I would of done a byte conversion, converting from

KB to MB=(KB/1024)
KB to TB=(KB/(1024*2))
KB to GB=(KB/(1024*3))
KB to PB=(KB/(1024*4))

Where the the NumberAxis should auto range depending on the value passed.