Ok I will run down what im trying to achieve and how I tryed to achieve it then I will explain why I tryed this method.
I have data from the KDD cup 1999 in its original format the data has 494k of rows with 42 columns.
My goal is trying to cluster this data unsupervised. From a previous question here:
I recieved this feedback:
For starters, you need to normalize the attributes to be of the same scale: when computing the euclidean distance as part of step 3 in your method, the features with values such as 239 and 486 will dominate over the other features with small values as 0.05, thus disrupting the result.
Another point to remember is that too many attributes can be a bad thing (curse of dimensionality). Thus you should look into feature selection or dimensionality reduction techniques.
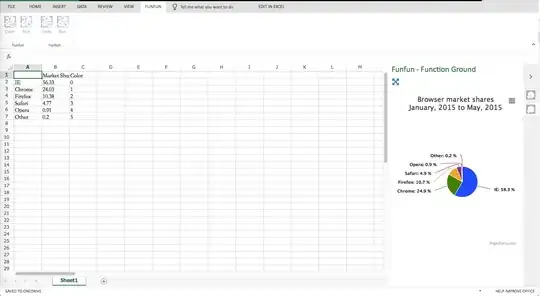
So the first thing I went about doing was addressing the feature selection which is related to this article: http://narensportal.com/papers/datamining-classification-algorithm.aspx#_sec-2-1
and looks like this after selecting the necessary features:
So for the clustering I removed the discrete values which left me with 3 columns with numeric data, I then went about removing the duplicate rows see: junk, index and unique on a matrix (how to keep matrix format) in the file which reduced the 3 columns from 494k to 67k which was done like so:
[M,ind] = unique(data, 'rows', 'first');
[~,ind] = sort(ind);
M = M(ind,:);
I then used the random permutation to reduce the file size from 67k to 1000 like so:
m = 1000;
n = 3;

%# pick random rows
indX = randperm( size(M,1) );
indX = indX(1:m);

%# pick random columns
indY = randperm( size(M,2) );
indY = indY(1:n);

%# filter data
data = M(indX,indY)
So now I have a file with 3 of my features which I selected I have removed duplicate records and used the random permutation to further reduce the dataset my last goal was to normalize this data and I did this with:
normalized_data = data/norm(data);
I then used the following K-means script:
%% generate clusters
K = 4;

%% cluster
opts = statset('MaxIter', 500, 'Display', 'iter');
[clustIDX, clusters, interClustSum, Dist] = kmeans(data, K, 'options',opts, ...
'distance','sqEuclidean', 'EmptyAction','singleton', 'replicates',3);

%% plot data+clusters
figure, hold on
scatter3(data(:,1),data(:,2),data(:,3), 50, clustIDX, 'filled')
scatter3(clusters(:,1),clusters(:,2),clusters(:,3), 200, (1:K)', 'filled')
hold off, xlabel('x'), ylabel('y'), zlabel('z')
%% plot clusters quality
figure
[silh,h] = silhouette(data, clustIDX);
avrgScore = mean(silh);

%% Assign data to clusters
% calculate distance (squared) of all instances to each cluster centroid
D = zeros(numObservarations, K);     % init distances
for k=1:K
%d = sum((x-y).^2).^0.5
D(:,k) = sum( ((data - repmat(clusters(k,:),numObservarations,1)).^2), 2);
end

% find  for all instances the cluster closet to it
[minDists, clusterIndices] = min(D, [], 2);
% compare it with what you expect it to be
sum(clusterIndices == clustIDX)
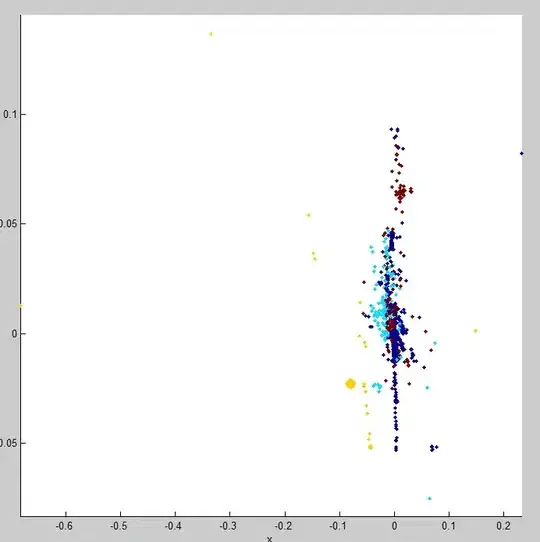
But my results are still coming out like my original question I asked here: clustering and matlab
Here is what the data looks like when plotted:

and:
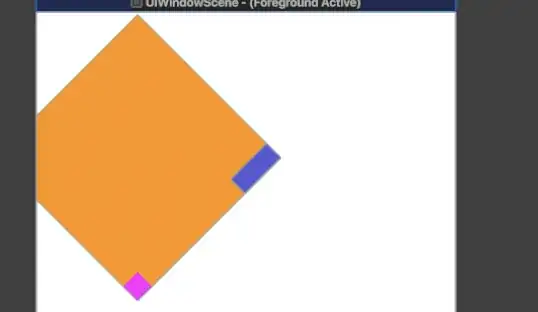
Can anyone help solve this problem, are the methods im using not the correct methods or is there something im missing?