15

I've tried every possible fields but can not find the number of times functions are called.

enter image description here

Besides, I don't get Self and # Self. What do these two numbers mean?

an0
  • 17,191
  • 12
  • 86
  • 136

4 Answers4

20

There are several other ways to accomplish this. One is obviously to create a static hit counter and an NSLog that emits and increments a counter. This is intrusive though and I found a way to do this with lldb.

  1. Set a breakpoint
  2. Execute the program until you hit the breakpoint the first time and note the breakpoint number on the right hand side of the line you hit (e.g. "Thread 1: breakpoint 7.1", note the 7.1)
  3. Context click on the breakpoint and choose "Edit Breakpoint"
  4. Leave condition blank and choose "Add Action"
  5. Choose "Debugger Command"
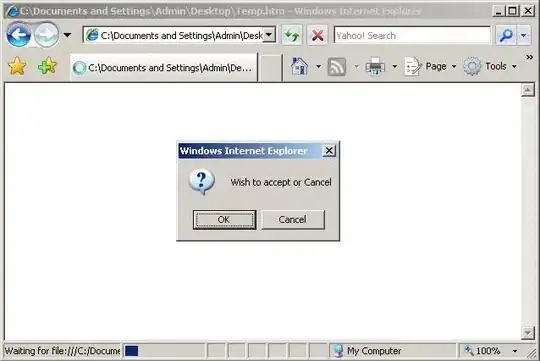
  6. In the command box, enter "breakpoint list 7.1" (using the breakpoint number for your breakpoint from step 2). I believe you can use "info break " if you are using gdb.enter image description here
  7. Check Options "Automatically Continue after evaluating" Breakpoint setup
  8. Continue

Now, instead of stopping, llvm will emit info about the breakpoint including the number of times it has been passed.

As for the discussion between Glenn and Mike on the previous answer, I'll describe a performance problem where function execution count was useful: I had a particular action in my app where performance degraded considerably with each execution of the action. The Instruments time profiler showed that each time the action was executed, a particular function was taking twice as long as the time before until quickly the app would hang if the action was performed repeatedly. With the count, I was able to determine that with each execution, the function was called twice as many times as it was during the previous execution. It was then pretty easy to look for the reason, which turned out to be that someone was re-registering for a notification in NotificationCenter on each event execution. This had the effect of doubling the number of response handler calls on each execution and thus doubling the "cost" of the function each time. Knowing that it was doubling because it was called twice as many times and not because the performance was just getting worse caused me to look at the calling sequence rather than for reasons the function itself could be degrading over time.

Pat
  • 814
  • 8
  • 9
  • 1
    Great, this is really helpful thanks. Don't forget to tick the 'Automatically continue after evaluating' box – dassimon Aug 05 '16 at 11:01
  • 2
    A similar way of doing this is to use the "Log message" breakpoint action and use in your message the special string `%H` which turns into the hit count, and `%B` which turns into the breakpoint name. I'm using `%B hit %H`. – Jon Colverson Mar 28 '17 at 03:35
  • 1
    For what it's worth, I'd use Jon Colverson's approach over mine. I think it's simpler and more flexible (e.g. you could also emit variable values in the same message). – Pat Dec 10 '19 at 17:30
3

While it's interesting, knowing the number of times called doesn't have anything to do with how much time is spent in them. Which is what Time Profiler is all about. In fact, since it does sampling, it cannot answer how many times.

David Dunham
  • 8,139
  • 3
  • 28
  • 41
  • 3
    + Glad to hear some common sense! – Mike Dunlavey Nov 21 '14 at 17:50
  • 6
    Knowing how many time a method is called can have something to do with how much time is spent in a function because if your logic is inadvertently calling the methods more times than it should, it is causing more time to be spent in that method. So there is merit in knowing the method call count as it allows you to evaluate your logic to ensure the method is not being called needlessly. – infinite-loop Sep 14 '18 at 23:10
3

It seems you cannot use Time Profiler for counting function calls. This question seems to address potential methods for counting.

W/ respect to self and #self:

Self is "The number of times the symbol calls itself." according to the Apple Docs on the Time Profiler.

From the way the numbers look though, it seems self is the summed duration of samples that had this symbol at the bottom of its stack trace. That would make:

  • # self: the number of samples where this symbol was at the bottom of the stack trace
  • % self: the percent of self samples relative to total samples of currently displayed call tree
    • (eg - #self / total samples).

So this wouldn't tell you how many times a method was called. But it would give you an idea how much time is spent in a method or lower in the call tree.


NOTE: I too am unsure about the various 'self' meanings though. Would love to see someone answer this authoritatively. Arrived here searching for that...

Community
  • 1
  • 1
waggles
  • 2,804
  • 1
  • 15
  • 16
  • 1
    Link to Apple Docs is wrong. Link: http://developer.apple.com/library/mac/#documentation/DeveloperTools/Conceptual/InstrumentsUserGuide/Introduction/Introduction.html – Peter Tseng Sep 21 '12 at 02:15
-3

IF your objective is to find out what you need to fix to make the program as fast as possible,

Number of calls and self time may be interesting but are irrelevant.

Look at my answer to this question, in particular points 6 and 8.

EDIT: To clarify the point further, suppose the following is the timeline of execution of the program. Some of that time (in this case about 50%) is spent in an activity that can be removed, if you know what it is, such as needless buried I/O, excessive calls to new, runaway notifications, or "insignificant" data validation. If a random-time sample is taken, it has a 50% chance of occurring in that activity, and an examination of the call stack and/or program variables shows that it is doing something that can be removed. Then, if 10 such samples are taken, the activity will be seen on roughly 5 of them, regardless of whether the activity occurs in a few large chunks of time, or many small ones. The activity may be a few lines of code in a function doing something unnecessary, or it may be something much more generalized. Regardless, you recognize it, fix it, and get roughly a factor of 2 speedup. Call counts and self time contribute nothing to this process.

enter image description here

Mike Dunlavey
  • 40,059
  • 14
  • 91
  • 135
  • 6
    Number of calls are absolutely important, since an important piece of data is whether a function is a hot spot because it takes too long, or because it's being called too many times. – Glenn Maynard Dec 05 '12 at 01:31
  • @Glenn: The rationale is in points 6, 8 of [*that link*](http://stackoverflow.com/a/1779343/23771). Basically the whole concept of "hot spot" is moot. What you need to know is what activity you can get rid of, and for that you need percent time spent in it (and you don't need to know it with high accuracy). Whether that percent of time consists of many small intervals or one big one is interesting, but what really matters is the overall percent taken by the activity. If you want more solid math, [*check here*](http://scicomp.stackexchange.com/a/2719/1262). – Mike Dunlavey Dec 05 '12 at 14:06
  • 3
    Having done a great deal of successful optimization (and not having time to debate this in detail), I'll just say that the conclusion that you don't need to be able to differentiate number-of-calls from time-per-call is completely false. – Glenn Maynard Dec 05 '12 at 16:29
  • @Glenn: I'm sure you did find speed bugs successfully by profiling. What's the most speedup you ever got? [*43x?*](http://stackoverflow.com/a/927773/23771) [*730x?*](http://sourceforge.net/projects/randompausedemo/) The issue is, there could be problems you *didn't* find, couldn't there? And if there were, do you suppose they're not worth worrying about? That's how I get the big speedups - by fixing several problems, ones that profilers don't find. The biggest difficulty in this business is the assumption that if no opportunity for speedup is found, then there isn't any. – Mike Dunlavey Dec 05 '12 at 17:23
  • 3
    Sorry, I don't know what any of that has to do with this. Being able to tell how many times a function is called is clearly useful. It's obviously not the *only* important data. – Glenn Maynard Dec 06 '12 at 18:33
  • @Glenn: You could be right that call counts help to find some problems of a kind I haven't seen yet *(in the 40 years I've been doing it ;-)*. I've never had to take more than 20 samples at one time in order to find a problem, so obviously I'm not getting call counts. I've been able to remove 90, 98, and 99.8% of time (as in the 730x case) without needing call counts. – Mike Dunlavey Dec 06 '12 at 20:31
  • 2
    One often overlooked use of call counts is to find poor algorithm choices. If an app is searching a list where a map can be used, one way it will be apparent is by how many times isEqual: is called. While optimizing a specific isEqual: method may improve performance, a bigger win may be found by changing O(N) performance to O(1). – tball Nov 20 '14 at 20:46
  • @tball: I guess I'm talking about "real" software, as opposed to little algorithm studies. Where big-O is not such an issue, but constant factors are hugely important. I think [*this post*](http://scicomp.stackexchange.com/a/2719/1262) is maybe where I've explained it best. – Mike Dunlavey Nov 21 '14 at 02:46
  • Real software can certainly have BigO issues. One company I worked at had an in-house ASIC designer, and it literally took over two days to run a verification on one big (late) design. Most of the time was spent in a connection table query function; it was highly optimized assembly code, but the call count showed it was called way too often. The culprit turned out to be nested for loops (O(n2)) several stack frames above; replacing them with an appropriate map dropped the verification time to less than 30 minutes, for two orders of magnitude improvement. It all depends on the task being run. – tball Nov 22 '14 at 06:55
  • @tball: You're right of course. I've occasionally seen those. One stackshot pinpoints the problem, because the guilty code is on it. – Mike Dunlavey Nov 22 '14 at 14:12
  • I recently got placed on a project to help a sick app. After doing some basic profiling I found that they were downloading 60 objects from a server, and rather than saving all 60 once, they saved 60 times, but it got worse, the call count for their saves was actually 298, so I do think there is real value in call counts because they can at least superficially point to where poor architecture choices may have been made. – Unome Jan 22 '16 at 23:01
  • @Unome: Call counts are in the nature of a hint. They find you something important maybe 50% of the time. You might be interested in the last couple comments [*here*](http://stackoverflow.com/a/378024/23771). I'm glad you found a speedup. In general, there can be several speedups lurking, and finding only 50% leaves the other 50% not found, which makes a huge difference, as in [*this post*](http://programmers.stackexchange.com/a/302345/2429). – Mike Dunlavey Jan 23 '16 at 16:56