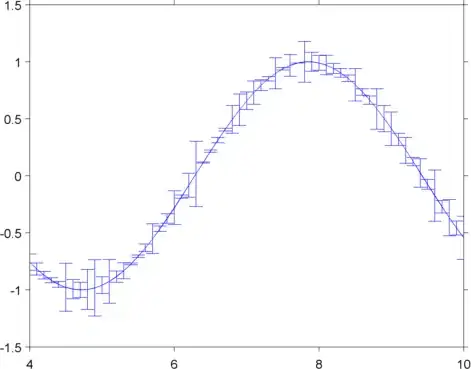
I am very new to MATLAB and expect a step-by-step solution. I have data, series(y), which I have to plot against (x). Also I have the standard deviation values for each data point of (y). Now I have to plot these series highlighting the error bars. How can I do that?
The data is in a text file sorted in columns as:
X = -50, -49, -48, -47....0....1, 2, 3, 4, 5....till 50

Y = 1.2, 1.0, 1.1, 1.9, 1.3.....
Standard deviation = 0.6, 0.5, 0.3, 0.6, 0.6.....
Also, how do I control the ticks and appearance property for these kinds of graphs?
