19

Can anyone recommend a performance profiling tool with good F# support?

I’ve been using Visual Studio 2010 profiler but I’ve found a few issues when using F#. It feels more like I’m profiling the byte code after reflection than the original F#.

For example when profiling the following slightly contrived example:

let Add a b = 
    a + b

let Add1 = Add 1

let rec MultiAdd count = 
    match count with
    | 1 -> 1
    | _ -> (Add1 1) + (MultiAdd (count - 1))

MultiAdd 10000 |> ignore

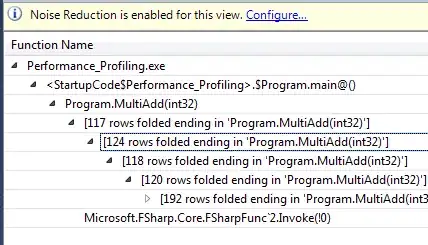
I get the following call tree:

CallTree

When I view Microsoft.FSharp.Core.FSharpFunc`2.Invoke(0) in the Function Details I see: Function Details

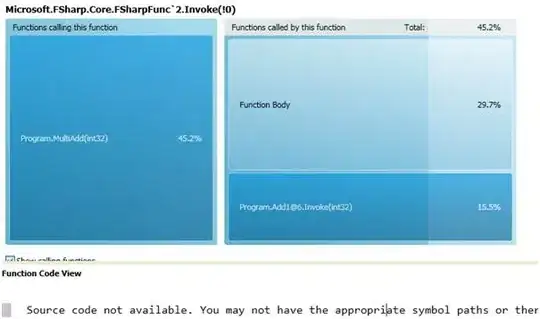
I understand that what I seeing is based on the underlying implementation of the compiled code and although I can follow it, it’s hard going.

Does anyone have experience of using other profiling tools with F# and do they do a better job of mapping to the original F# code?

pad
  • 41,040
  • 7
  • 92
  • 166
Keith Harrison
  • 1,567
  • 14
  • 22
  • Have you tried the option for CPU sampling instead of the instrumentation on function calls? – gradbot Nov 08 '11 at 00:22
  • 2
    I've not looked at this recently so I can't say what the best options are now but at the time I used dotTrace and just got used to working with the decompiled code dotTrace generated. Tracing through all the '.Invoke()' calls is actually quite useful for diagnosing performance issues as it shows you what's really going on under the hood. As a general rule the more complex the decompiled code was the slower it ran. – Keith Harrison Jul 09 '18 at 08:55

2 Answers2

8

My answer may disappoint you, but it might be helpful.

A few months ago, I tried to find a good free .NET profiler for my F# project. My experience with nprof, slimtune, EQATEC and (recently commercial) Xte profiler was not decent at all. I found their support for F# was very limited, and had to fall back to Visual Studio 2010 profiler. I think your best bet here is some commercial profiler (which I have no experience with).

After some time, I get used to the profiler and see its presentation of results easy, clear and understandable. If you were optimizing parallel programs, using the Concurrent Visualizer would be unavoidable. That said the single thing you care is performance; getting on well with VS 2010 profiler is worth to try.

For profiling F# code, I also find CLR Profiler and ILSpy worth to mention. The former can visualize heaps in case you want to minimalize memory allocation or garbage collection. The latter can produce equivalent code in IL or C# (which I'm more familiar with than F#); it may help to understand how high-order constructs in F# work in order to use them appropriately.

UPDATE:

Dave Thomas has written an excellent blog post where he used several commercial profilers to detect memory leaks and tune an asynchronous application. Take a look at those profilers; they may suit your preference.

Andrew Keeton
  • 22,195
  • 6
  • 45
  • 72
pad
  • 41,040
  • 7
  • 92
  • 166
  • 2
    Thanks for the mention! The main problem is mapping the names back to the F# types, checkout the evaluation of http://www.jetbrains.com/profiler/ if had a 'lines of code' option which allow you to profile down to the offending line – 7sharp9 Jan 10 '12 at 00:25
4

It sounds like your profiling in Debug mode. You need to enable "Optimize code" from project -> properties -> build menu. You could also profile in release mode which has this enabled by default. If you don't there will be lots of invoke calls and Tuple object creation among other things.

The MultiAdd function above is not tail recursive. If it were, you would also need to enable "Generate tail calls" in Debug mode for profiling.

enter image description here

This would also be a good case for tail call optimization.

let Add a b = 
    a + b

let Add1 = Add 1

let rec MultiAdd total count =
    match count with
    | 1 -> 1 + total
    | _ -> MultiAdd (count - 1) (total + Add1 1)

MultiAdd 10000 0 |> ignore

enter image description here

gradbot
  • 13,732
  • 5
  • 36
  • 69
  • I tried running it in release mode and ensured "Optimize code" is checked but still got the same result. Am I missing something? – Keith Harrison Nov 02 '11 at 10:08
  • 2
    @KeithHarrison the invoke calls won't go away in this case because this function isn't tail recursive. Try the tail call version I added. The debugger also has a noise reduction filter. You can set it to ignore calls below a % time. – gradbot Nov 02 '11 at 22:11