5

When debugging programs in Xcode 3, I often used the Memory Browser in a seperate window to view the contents of a buffer change while I step through the lines of code.

As I now started using Xcode 4, I wonder how to open a Memory Browser. I can't find anything like that in the UI. Can anybody provide help?
Tafkadasoh
  • 4,667
  • 4
  • 27
  • 31

3 Answers3

7

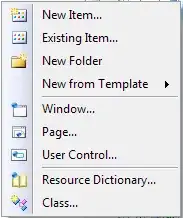
Select Product > Debug > View Memory while debugging or press Shift-Cmd-M. This will display the memory browser and add an entry for 'Memory' into the Debug navigator:

enter image description here

You can also right-click on a variable in the Debug panel and select View Memory of "*<variable name>" to jump straight to displaying memory for that variable.

enter image description here

Robin Summerhill
  • 13,695
  • 3
  • 41
  • 37
  • Great! Thanks a lot! In addition, I'd like to acknowledge Mats hint below about opening the memory browser in a tab. – Tafkadasoh Nov 09 '11 at 17:27
  • As of Xcode 11, the keyboard shortcut is `⌘^⌥⇧M`. After entering that, press enter to open the memory browser in the main editor. – Eric Apr 06 '20 at 11:05
1

I open it when i debug. I place a breakpoint, right click on an variable -> View In Memory "..." .

It will open in a tab, but you can drag the tab out of the Xcode tab-bar.

Mats Stijlaart
  • 5,058
  • 7
  • 42
  • 58
  • Thanks! I especially like your hint that it's possible to open the browser in a new tab. Without the tab usage, the memory browser is pretty useless when you try to put it in the right view of the Assistant editor view. – Tafkadasoh Nov 09 '11 at 17:25
  • I'm using Xcode 4.6 It is not tabbed. The memory window only seems to open in the same window as the main debug window. I would like have it be in an assistant editor window or a free standing window so I can monitor it as I step through the code. I can't seem to drag the memory window out of the Xcode frame to make it freestanding. – Will Sep 10 '13 at 23:55
  • This answer dates from almost two years ago. I'm not sure how this can be achieved in newer versions of XCode. – Mats Stijlaart Sep 11 '13 at 06:00
  • Would it be appropriate to create a new question? – Will Sep 11 '13 at 18:28
  • This answer was not marked as the correct answer for the question. If the answer for the question does not suit you and if your question is different from the original, then you should create a new question. – Mats Stijlaart Sep 11 '13 at 20:15
0

As of xCode 12.4 you could open the memory view by going to debug->Debug Workflow=> view memory

enter image description here

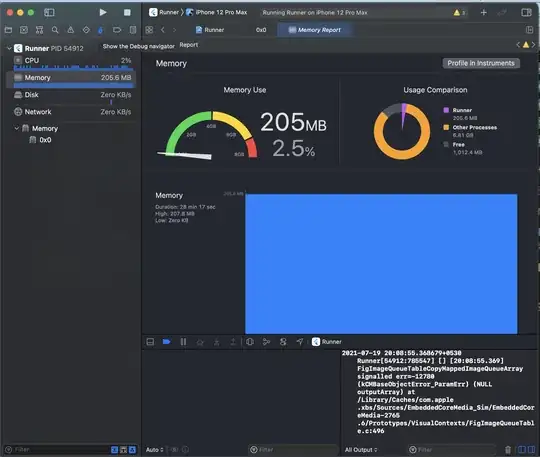
And then on the left top click show the debug navigator tab

enter image description here

Mahesh Jamdade
  • 17,235
  • 8
  • 110
  • 131