5

I want to plot a regression line with (a = 0 and b = 1) and add the individual point deviations from this along with identifying the data point with name.

set.seed(123)
namelab <- paste ("ET", 1:10, sep = "")
xvar <- 1:10
yvar <- rnorm(10, 5, 5)
myd <- data.frame(namelab, xvar, yvar)
plot(xvar, yvar)
abline (a= 0, b = 1, col = "red", lty = 2)

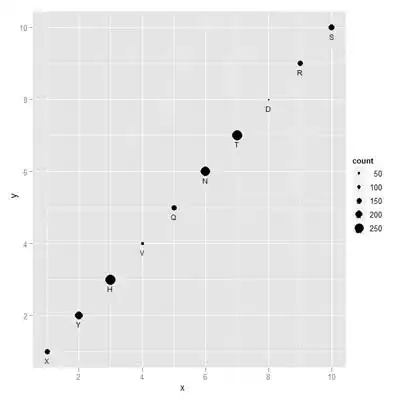
Just manual sketch of my intention, I just labelled a single point just for example. The line drawn need a slim. enter image description here

Gavin Simpson
  • 170,508
  • 25
  • 396
  • 453
jon
  • 11,186
  • 19
  • 80
  • 132
  • 2
    Possible duplicate: http://stackoverflow.com/questions/2639430/graphing-perpendicular-offsets-in-a-least-squares-regression-plot-in-r – John Colby Nov 10 '11 at 05:24
  • 2
    But do you really want to plot *perpendicular* offsets though? Regression usually minimizes the *vertical* offsets. – John Colby Nov 10 '11 at 05:25
  • 1
    @John Colby, there is some difference what I intend to do and the link suggested. (1) I do not intend to fit based on Y and X (rather a abline with constant a= 0, b=1) (2) put labels to it. However, if my search engine was able to find the above post....I would have solved my problem my self...thanks – jon Nov 10 '11 at 11:58
  • @John: The questioner in that link above obviously knew that ordinary regression uses just the y-deviation. It's not so clear that you do. You should be sure that the xy-deviations of Deming regression (aka othogonal regression , total least squares regression) are really what you want to illustrate. They are not what ordinary regression uses. – IRTFM Nov 10 '11 at 13:09
  • 1
    @john, the OLS vs total least squares was confusing to me when I first ran across it. I blogged about it here: http://www.cerebralmastication.com/2010/09/principal-component-analysis-pca-vs-ordinary-least-squares-ols-a-visual-explination/ – JD Long Nov 10 '11 at 14:10
  • @John No worries...that's why I didn't vote to close it. – John Colby Nov 10 '11 at 16:27

2 Answers2

14
dev.new(width=4, height=4)
plot(xvar, yvar, asp=1)

a = 0
b = 1

abline (a, b, col = "red", lty = 2)

myd$xint = with(myd, (b*yvar + xvar - b*a) / (b^2 + 1))
myd$yint = with(myd, (b*yvar + b*xvar + a) / (b^2 + 1))

with(myd, segments(xvar, yvar, xint, yint))
with(myd, text(xvar, yvar, labels=namelab, pos=3, cex=0.5))

enter image description here

John Colby
  • 22,169
  • 4
  • 57
  • 69
  • 1
    Thanks for that. I have been looking at one point for perpendiculars to a line and could find it. And you also show how to neatly shrink illustrations for SQ. Doubleplusgood. – IRTFM Nov 10 '11 at 12:59
4

...and if you did want vertical as opposed to perpendicular offsets, here is a pretty straightforward option:

set.seed(123)
namelab <- paste ("ET", 1:10, sep = "")
xvar <- 1:10
yvar <- rnorm(10, 5, 5)

plot(xvar, yvar)
abline (a= 0, b = 1, col = "red", lty = 2)
segments(xvar,yvar,xvar,xvar)
text(xvar,yvar,namelab,pos=3)

enter image description here

For this to work for any value of a and b, you would use:

segments(xvar,yvar,xvar,((xvar*b)+a))
thelatemail
  • 91,185
  • 12
  • 128
  • 188