PivotTables in Excel (or, cross tabulations) are quite useful. Has anyone already thought about how to implement a similar function in Mathematica?
Asked
Active
Viewed 2,947 times
13
-
Aren't pivot tables a combination of filters and projections? Or are you thinking in the excel UI for pivot tables? – Dr. belisarius Nov 11 '11 at 21:41
-
@rcollyer, SelectEquivalents in http://stackoverflow.com/questions/4198961/what-is-in-your-mathematica-tool-bag/6245166#6245166 would probably be quite useful for this. – faysou Nov 11 '11 at 21:43
-
@belisarius, in fact I'm thinking at both but first at obtaining the right data (right being configurable!). – faysou Nov 11 '11 at 21:45
-
Agreed, probably useful. I'm not sure if I've done it, although I probably have. Also, I just added the more generic term, cross tabulation, to the post. – rcollyer Nov 11 '11 at 21:47
-
Ideally I would have accepted both you and Sjoerd as you two contributed to your solution; your answer provides an all in one solution that's why I accept it. – faysou Nov 14 '11 at 16:57
6 Answers
10
I am not familiar with the use of pivot tables, but taking the example on the page linked above, I propose this:
Needs["Calendar`"]
key = # -> #2[[1]] & ~MapIndexed~
       {"Region", "Gender", "Style", "Ship Date", "Units", "Price", "Cost"};
choices = {
   {"North", "South", "East", "West"},
   {"Boy", "Girl"},
   {"Tee", "Golf", "Fancy"},
   IntegerString[#, 10, 2] <> "/2011" & /@ Range@12,
   Range@15,
   Range[8.00, 15.00, 0.01],
   Range[6.00, 14.00, 0.01]
   };
data = RandomChoice[#, 150] & /@ choices // Transpose;
This creates data that looks like:
 {"East", "Girl", "Golf", "03/2011", 6, 12.29`, 6.18`},
 {"West", "Boy", "Fancy", "08/2011", 6, 13.01`, 12.39`},
 {"North", "Girl", "Golf", "05/2011", 1, 14.87`, 12.89`},
 {"East", "Girl", "Golf", "09/2011", 3, 13.99`, 6.25`},
 {"North", "Girl", "Golf", "09/2011", 13, 12.66`, 8.57`},
 {"East", "Boy", "Fancy", "10/2011", 2, 14.46`, 6.85`},
 {"South", "Boy", "Golf", "11/2011", 13, 12.45`, 11.23`}
 ...
Then:
h1 = Union@data[[All, "Region" /. key]];
h2 = Union@data[[All, "Ship Date" /. key]];

Reap[
   Sow[#[[{"Units", "Ship Date"} /. key]], #[["Region" /. key]]] & ~Scan~ data,
   h1,
   Reap[Sow @@@ #2, h2, Total @ #2 &][[2]] &
][[2]];

TableForm[Join @@ %, TableHeadings -> {h1, h2}]
This is a rough example, but it gives an idea of how this may be done. If you have more specific requirements I will attempt to address them.
Here is an update in the manner of Sjoerd's answer.
The Manipulate block is largely copied, but I believe my pivotTableData is more efficient, and I sought to localize symbols correctly, since this is now presented as usable code rather than a rough example.
I start with the same sample data, but I embed the field headings, since I feel this is more representative of normal use.
data = ImportString[#, "TSV"][[1]] & /@ Flatten[Import["http://lib.stat.cmu.edu/datasets/CPS_85_Wages"][[28 ;; -7]]];

data = Transpose[{
    data[[All, 1]],
    data[[All, 2]] /. {1 -> "South", 0 -> "Elsewhere"},
    data[[All, 3]] /. {1 -> "Female", 0 -> "Male"},
    data[[All, 4]],
    data[[All, 5]] /. {1 -> "Union Member", 0 -> "No member"},
    data[[All, 6]],
    data[[All, 7]],
    data[[All, 8]] /. {1 -> "Other", 2 -> "Hispanic", 3 -> "White"},
    data[[All, 9]] /. {1 -> "Management", 2 -> "Sales", 3 -> "Clerical", 4 -> "Service", 5 -> "Professional", 6 -> "Other"},
    data[[All, 10]] /. {0 -> "Other", 1 -> "Manufacturing", 2 -> "Construction"},
    data[[All, 11]] /. {1 -> "Married", 0 -> "Unmarried"}
}];

PrependTo[data,
  {"Education", "South", "Sex", "Experience", "Union", "Wage", "Age", "Race", "Occupation", "Sector", "Marriatal status"}
  ];
My pivotTableData is self contained.
pivotTableData[data_, field1_, field2_, dependent_, op_] :=
  Module[{key, sow, h1, h2, ff},
    (key@# = #2[[1]]) & ~MapIndexed~ data[[1]];
    sow = #[[key /@ {dependent, field2}]] ~Sow~ #[[key@field1]] &;
    {h1, h2} = Union@data[[2 ;;, key@#]] & /@ {field1, field2};
    ff = # /. {{} -> Missing@"NotAvailable", _ :> op @@ #} &;
    {
     {h1, h2},
     Join @@ Reap[sow ~Scan~ Rest@data, h1, ff /@ Reap[Sow @@@ #2, h2][[2]] &][[2]]
    }
  ]
pivotTable relies only on pivotTableData:
pivotTable[data_?MatrixQ] :=
 DynamicModule[{raw, t, header = data[[1]], opList =
    {Mean              -> "Mean of \[Rule]",
     Total             -> "Sum of \[Rule]",
     Length            -> "Count of \[Rule]",
     StandardDeviation -> "SD of \[Rule]",
     Min               -> "Min of \[Rule]",
     Max               -> "Max of \[Rule]"}},
  Manipulate[
   raw = pivotTableData[data, f1, f2, f3, op];
   t = ConstantArray["", Length /@ raw[[1]] + 2];
   t[[1, 1]] = Control[{op, opList}];
   t[[1, 3]] = Control[{f2, header}];
   t[[2, 1]] = Control[{f1, header}];
   t[[1, 2]] = Control[{f3, header}];
   {{t[[3 ;; -1, 1]], t[[2, 3 ;; -1]]}, t[[3 ;; -1, 3 ;; -1]]} = raw;
   TableView[N@t, Dividers -> All],
   Initialization :> {op = Mean, f1 = data[[1,1]], f2 = data[[1,2]], f3 = data[[1,3]]}
  ]
 ]
Use is simply:
pivotTable[data]
10
A quick-and-dirty pivot table visualization:
I'll start with a more interesting real-life data set:
data = ImportString[#, "TSV"][[1]] & /@
          Flatten[Import["http://lib.stat.cmu.edu/datasets/CPS_85_Wages"][[28 ;; -7]]
       ];
A bit of post-processing:
data =
  {
    data[[All, 1]],
    data[[All, 2]] /. {1 -> "South", 0 -> "Elsewhere"},
    data[[All, 3]] /. {1 -> "Female", 0 -> "Male"},
    data[[All, 4]],
    data[[All, 5]] /. {1 -> "Union Member", 0 -> "No member"},
    data[[All, 6]],
    data[[All, 7]],
    data[[All, 8]] /. {1 -> "Other", 2 -> "Hispanic", 3 -> "White"},
    data[[All, 9]] /. {1 -> "Management", 2 -> "Sales", 3 -> "Clerical",
                      4 -> "Service", 5 -> "Professional", 6 -> "Other"},
    data[[All, 10]] /. {0 -> "Other", 1 -> "Manufacturing", 2 -> "Construction"},
    data[[All, 11]] /. {1 -> "Married", 0 -> "Unmarried"}
  }\[Transpose];

header = {"Education", "South", "Sex", "Experience", "Union", "Wage",
          "Age", "Race", "Occupation", "Sector", "Marriatal status"};
MapIndexed[(headerNumber[#1] = #2[[1]]) &, header];
levelNames = Union /@ Transpose[data];
levelLength = Length /@ levelNames;
Now for the real stuff. It also uses the function SelectEquivalents defined in What is in your Mathematica tool bag?
pivotTableData[levelName1_, levelName2_, dependent_, op_] :=
 Table[
  SelectEquivalents[data,
    FinalFunction -> (If[Length[#] == 0, Missing["NotAvailable"], op[# // Flatten]] &),
    TagPattern ->
        _?(#[[headerNumber[levelName1]]] == levelMember1 &&
           #[[headerNumber[levelName2]]] == levelMember2 &),
    TransformElement -> (#[[headerNumber[dependent]]] &)
   ],
   {levelMember1, levelNames[[headerNumber[levelName1]]]},
   {levelMember2, levelNames[[headerNumber[levelName2]]]}
 ]

DynamicModule[
 {opList =
    {Mean ->"Mean of \[Rule]", Total ->"Sum of \[Rule]", Length ->"Count of \[Rule]",
     StandardDeviation -> "SD of \[Rule]", Min -> "Min of \[Rule]",
     Max -> "Max of \[Rule]"
    }, t},
 Manipulate[
  t=Table["",{levelLength[[headerNumber[h1]]]+2},{levelLength[[headerNumber[h2]]]+2}];
  t[[3 ;; -1, 1]] = levelNames[[headerNumber[h1]]];
  t[[2, 3 ;; -1]] = levelNames[[headerNumber[h2]]];
  t[[1, 1]] = Control[{op, opList}];
  t[[1, 3]] = Control[{h2, header}];
  t[[2, 1]] = Control[{h1, header}];
  t[[1, 2]] = Control[{h3, header}];
  t[[3 ;; -1, 3 ;; -1]] = pivotTableData[h1, h2, h3, op] // N;
  TableView[t, Dividers -> All],
  Initialization :> {op = Mean, h1 = "Sector", h2 = "Union", h3 = "Wage"}
  ]
 ]


There's still a bit of work to do. The DynamicModule should be turned into a fully standalone function, with the header stuff more streamlined, but this should be sufficient for a first impression.
Community
- 1
- 1
Sjoerd C. de Vries
- 16,122
- 3
- 42
- 94
-
1+1 for a full implementation. (I didn't test it, but I trust you.) One caveat though: it appears you use `SelectEquivalents` and IMO you need to include this definition in your post, since it is nonstandard and there are several versions about. – Mr.Wizard Nov 12 '11 at 19:54
-
@Mr.Wizard Thought I'd leave it out as there were already some reference to this function in the other posts. I included a link to the toolbag version now. – Sjoerd C. de Vries Nov 12 '11 at 20:00
-
I would make it easy on myself ( and the customer's bill ) by using Excel but you nicely show there aren't much limitations to mma as a programming language. - How do we tell that to the world? – nilo de roock Nov 13 '11 at 08:47
-
1Cool! Been waiting to hear more about `TableView` since its accidential discovery by some folks in MathGroup more than a year ago ( http://forums.wolfram.com/mathgroup/archive/2009/Oct/msg00186.html) It still undocumented in Version 8.0.4. Any news/updates/new hacks on this much-needed feature? – kglr Nov 14 '11 at 10:16
-
@kguler No, other than its use being signalled during one of the presentations of the recent virtual conference. I used it here for a more Excel-like look. I used `Grid` initially. – Sjoerd C. de Vries Nov 14 '11 at 11:39
4
@Mr.Wizard's answer is indeed robust and long-lasting as it grounds on ReapSow method suitable for some map reduce jobs in Mathematica. Due to the fact that MMA itself develops, consider a new option as well.
GroupBy (introduced in Mathematica v.10.0) provides a generalization of the map reduce operation.
So, the above data job may be implemented as follows (partly an overkill for readability):
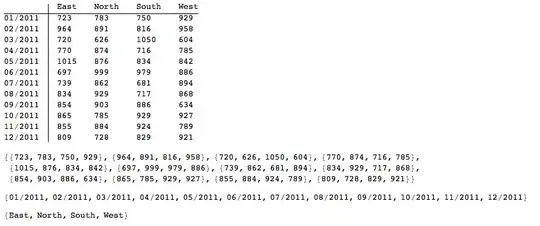
headings = Union @ data[[All, #]] & /@ {1, 4}
{{"East", "North", "South", "West"}, {"01/2011", "02/2011", "03/2011", "04/2011", "05/2011", "06/2011", "07/2011", "08/2011", "09/2011", "10/2011", "11/2011", "12/2011"}}
We may use Outer to set up a rectangular template for TableForm:
template = Outer[List, Apply[Sequence][headings]];
Main job with GroupBy and Total as third argument:
pattern = Append[Normal @
 GroupBy[data, (#[[{1, 4}]] &) -> (#[[-1]] &), Total],
 _ -> Null];
Finally, inject pattern into template (and apply TableForm headings for beauty):
TableForm[Replace[template, pattern, {2}], TableHeadings -> headings]
This outputs some:

Note: we have made a total of last column in data. (Many other aggregations are, of course, possible.)
garej
- 508
- 1
- 8
- 24
3
Use http://www.wolfram.com/products/applications/excel_link/ , this way you have the best of both worlds. This product creates a flawless link between Excel and mma, 2-ways.
nilo de roock
- 4,077
- 4
- 34
- 62
-
That product doesn't seem to have been updated for version 8 of Mathematica. I also wonder how it would handle the `.xlsx` format. – Verbeia Nov 13 '11 at 00:47
2
Here's what I've come up with. It uses the function SelectEquivalents defined in What is in your Mathematica tool bag?. Function1 and Function2 are meant to have different grouping possibilities of criteria1 and criteria2. FilterFunction is here in order to define an arbitrary filter formula on the data based on the header names.
Using the data example of Mr. Wizard here are some usages of this function.
criteria={"Region", "Gender", "Style", "Ship Date", "Units", "Price", "Cost"};
criteria1 = "Region";
criteria2 = "Ship Date";
consideredData = "Units";

PivotTable[data,criteria,criteria1,criteria2,consideredData]
A neat example
function2 = If[ToExpression@StringTake[#, 2] <= 6, "First Semester", "Second Semester"] &;
PivotTable[data,criteria,criteria1,criteria2,consideredData,FilterFunction->("Gender"=="Girl"&&"Units"*"Price"<=100&),Function2->function2]
Here's the definition of the function
keysToIndex[keys_] :=
   Module[{keyIndex},
      (keyIndex[#1] = #2[[1]])&~MapIndexed~keys;
      keyIndex
   ];

InverseFlatten[l_,dimensions_]:= Fold[Partition[#, #2] &, l, Most[Reverse[dimensions]]];

Options[PivotTable]={Function1->Identity,Function2->Identity,FilterFunction->(True &),AggregationFunction->Total,FormatOutput->True};

PivotTable[data_,criteria_,criteria1_,criteria2_,consideredData_,OptionsPattern[]]:=
    Module[{criteriaIndex, criteria1Index, criteria2Index, consideredDataIndex, criteria1Function, criteria2Function, filterFunctionTranslated, filteredResult, keys1, keys1Index, keys2, keys2Index, resultTable, function1, function2, filterFunction, aggregationFunction, formatOutput,p,sharp},

    function1 = OptionValue@Function1;
    function2 = OptionValue@Function2;
    filterFunction = OptionValue@FilterFunction;
    aggregationFunction = OptionValue@AggregationFunction;
    formatOutput=OptionValue@FormatOutput;

    criteriaIndex=keysToIndex[criteria];

    criteria1Index=criteriaIndex@criteria1;
    criteria2Index=criteriaIndex@criteria2;
    consideredDataIndex=criteriaIndex@consideredData;

    criteria1Function=Composition[function1,#[[criteria1Index]]&];
    criteria2Function=Composition[function2,#[[criteria2Index]]&];
    filterFunctionTranslated = filterFunction/.(# -> p[sharp, criteriaIndex@#]& /@ criteria /. sharp -> #)/.p->Part;

    filteredResult=
        SelectEquivalents[
            data
            ,
            TagElement->({criteria1Function@#,criteria2Function@#,filterFunctionTranslated@#}&)
            ,
            TransformElement->(#[[consideredDataIndex]]&)
            ,
            TagPattern->_?(#[[3]]&)
            ,
            TransformResults->(Append[Most@#1,aggregationFunction@#2]&)
        ];

    If[formatOutput,
        keys1=filteredResult[[All,1]]//Union//Sort;
        keys2=filteredResult[[All,2]]//Union//Sort;
        resultTable=
           SelectEquivalents[
              filteredResult
              ,
              TagElement->(#[[{1,2}]]&)
              ,
              TransformElement->(#[[3]]&)
              ,
              TagPattern->Flatten[Outer[List, keys1, keys2], 1]
              ,
              FinalFunction-> (InverseFlatten[Flatten[#/.{}->Missing[]],{Length@keys1,Length@keys2}]&)
           ];

        TableForm[resultTable,TableHeadings->{keys1,keys2}]
        ,
        filteredResult
    ]
];
1
I little latter in the game. Here is another self contained solution with object like form.
Using random data created by @Mr.Wizard:
    key = # -> #2[[1]] & ~MapIndexed~
       {"Region", "Gender", "Style", "Ship Date", "Units", "Price", "Cost"};
choices = {
   {"North", "South", "East", "West"},
   {"Boy", "Girl"},
   {"Tee", "Golf", "Fancy"},
   IntegerString[#, 10, 2] <> "/2011" & /@ Range@12,
   Range@15,
   Range[8.00, 15.00, 0.01],
   Range[6.00, 14.00, 0.01]
   };
data = RandomChoice[#, 5000] & /@ choices // Transpose;
Using an MapIndexed and SparseArray as key functions, here is the code:
Options[createPivotTable]={"RowColValueHeads"-> {1,2,3},"Function"-> Total};
createPivotTable[data_,opts:OptionsPattern[{createPivotTable}]]:=Module[{r,c,v,aggDataIndex,rowRule,colRule,pivot},

    {r,c,v}=OptionValue["RowColValueHeads"];

    pivot["Row"]= Union@data[[All,r]];
    pivot["Col"]= Union@data[[All,c]];

    rowRule= Dispatch[#->#2[[1]]&~MapIndexed~pivot["Row"]];
    colRule= Dispatch[#->#2[[1]]&~MapIndexed~pivot["Col"]];

    aggDataIndex={#[[1,r]]/.rowRule,#[[1,c]]/.colRule}->OptionValue["Function"]@#[[All,v]]&/@GatherBy[data,#[[{r,c}]]&];

    pivot["Data"]=Normal@SparseArray@aggDataIndex;
    pivot["Properties"]={"Data","Row","Col"};
    pivot["Table"]=TableForm[pivot["Data"], TableHeadings -> {pivot["Row"], pivot["Col"]}];
    Format[pivot]:="PivotObject";
    pivot
]
That you can use as:
pivot=createPivotTable[data,"RowColValueHeads"-> ({"Ship Date","Region","Units"}/.key)];
pivot["Table"]
pivot["Data"]
pivot["Row"]
pivot["Col"]
To get:
I believe that the speed is faster than @Ms.Wizard, but I have to make a better test, and don't have time now.
Murta
- 2,037
- 3
- 25
- 33
-
1@Mr.Wizard I believe that this is a nice question to be migrated into MathematicaSE. – Murta Jan 22 '14 at 09:02