x <- c(2, 8, 11, 19)
stripchart(x)

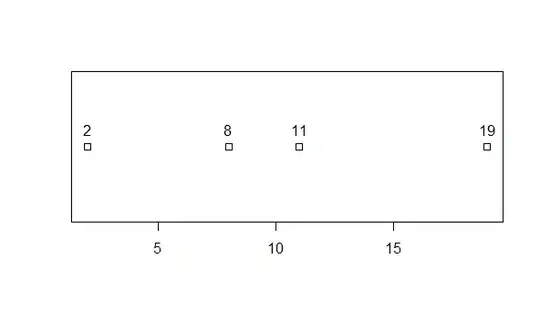
How do you add labels 2, 8, 11, 19 next to the points?
Use text and specify the y position. The stripchart is drawn with y=1, so text(x, y=1.1, ...) will draw the labels slightly above the points.
x <- c(2, 8, 11, 19)
stripchart(x)
text(x, 1.1, labels=x)