1

I'm visualising some data using filled.contour() with the following code:

filled.contour(x, y, z, col = rainbow(256),nlevels=(256),
  plot.title = title(main = "z",
  xlab = "x", ylab = "y"),
  key.title = title(main="T"),
)

which generates the following plot: enter image description here

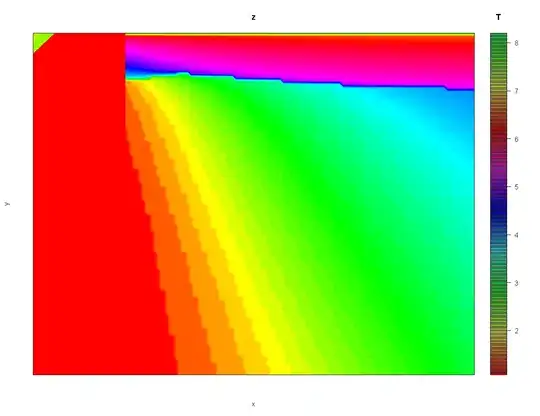
However, when I try and log the data, the colour palette is recycled, which makes the point of this kind of image a bit pointless...:

filled.contour(x, y, log(z), col = rainbow(256),nlevels=(256),
  plot.title = title(main = "z",
  xlab = "x", ylab = "y"),
  key.title = title(main="T"),
)       

enter image description here

I have also tried z <- log(z) and then calling filled.contour(x,y,z,...) but this produces the same result. I have tried changing the values passed to col=rainbow() and nlevels() but this also doesn't make any difference.

ChrisW
  • 4,970
  • 7
  • 55
  • 92

1 Answers1

0

I can reproduce a similarly weird plot if I have negative values in my matrix (and hence NA/NaN values in my log(z) matrix):

n <- 25; x <- y <- seq(n); z <- outer(x,y,function(x,y) (x-15)^2*(y-10)^3)
filled.contour(x,y,z,col=rainbow(256),nlevels=256)
filled.contour(x,y,log(z),col=rainbow(256),nlevels=256)  ## warning: NaNs produced
filled.contour(x,y,log(pmax(z,0.001)),col=rainbow(256),nlevels=256)

I used pmax to fix things up, your solution may depend on your problem.

I'm not sure that's your problem, but since you haven't given us a reproducible example ...

I have to say that I haven't really found the root of the problem -- the simple example below gives reasonable answers even with Inf values -- but I don't have time to dig further right now.

x <- 1:5
y <- 1:5
z <- matrix(outer(x,y,"+"),nrow=5)

filled.contour(x,y,z)
filled.contour(x,y,z,color.palette=rainbow)
z2 <- z

z2[5,5] <- Inf

filled.contour(x,y,z2,color.palette=rainbow)
filled.contour(x,y,z2,col=rainbow(100),nlevels=100)
Ben Bolker
  • 211,554
  • 25
  • 370
  • 453
  • This did lead me to the solution (`filled.contour()` doesn't like -Infs!) - I was concious I hadn't given a reproducible example, but the data that generates the above plots is ~1 gb... – ChrisW Nov 14 '11 at 17:12
  • 1
    True, but ... part of the art of reproducible questions is precisely finding a way to cut your examples down to size. In the process, you often figure out the answer yourself ... as usual, see http://stackoverflow.com/questions/5963269/how-to-make-a-great-r-reproducible-example ... admittedly it would be better if `filled.contour` did something sensible with `Inf` values : – Ben Bolker Nov 14 '11 at 17:34