As with any memory management issue, this is a long story, so strap-in.
We have an application that has been suffering from some memory management issues, so I've been trying to profile the app to get an idea of where the problem lies. I saw this thread earlier today:
Tomcat Session Eviction to Avoid OutOfMemoryError
... which seems to follow suit with what I was seeing in the profiler. Basically, if I hit the app with a bunch of users with Jmeter it would hold onto the heap memory for a long time, eventually until the sessions began to expire. Unlike the poster in that thread however, I have the source, and the option to try to implement persistent state sessions with Tomcat, which is what I've been trying to do today, with limited success. I think it is some configuration setting I am missing. Here is what I have in context.xml:
  <Manager className='org.apache.catalina.session.PersistentManager'
                saveOnRestart='false'
                maxActiveSessions='5'
                minIdelSwap='0'
                maxIdleSwap='1'
                maxInactiveInterval='600'
                maxIdleBackup='0'>
   <Store className='org.apache.catalina.session.FileStore'/>
   </Manager>
And in web.xml I have this:
<session-config>
    <session-timeout>
        10
    </session-timeout>
</session-config>
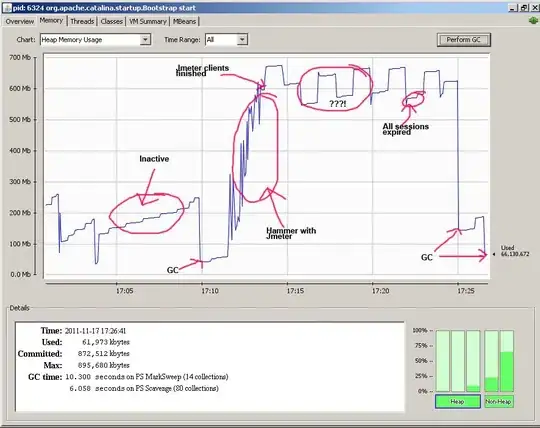
Ideally I would like the sessions to timeout in an hour, but for testing purposes this is fine. Now after having played around with some things and finally coming to these settings, I am watching the app in the profiler and this is what I am seeing:

As you can see in the image, I have put some annotations. It's the part circled around the question mark which I really do not understand more than anything else. You can see that I am using the Jconsole 'Perform GC' button at a few different points, and you can see the part in the chart where I am hitting the application with many client with Jmeter.
If I recall correctly (I'd have to go back and really document it to be sure), before I implemented persistent state, the GC button would not do nearly as much with regards to clearing the heap. The strange bit here is that it seems like I have to manually run GC for this persistent state to actually help with anything.
Alternatively, is this just a plain memory leak scenario? Earlier today, I took a heap dump and loaded it into Eclipse Memory Analyzer tool, and used the 'Detect Leak' feature, and all it did was reinforce the theory that this is a session size issue; the only leak it detected was in java.util.concurrent.ConcurrentHashMap$Segment which led me to this thread Memory Fully utilized by Java ConcurrentHashMap (under Tomcat)
which makes me think it's not the app that's actually leaking.
Other relevant details: - Running/testing this on my local machine for the time being. That's where all these results come from. - Using Tomcat 6 - This is a JSF2.0 app - I have added the system property -Dorg.apache.catalina.STRICT_SERVLET_COMPLIANCE=true as per the Tomcat documentation
So, I guess there is several questions here: 1. Do I have this configured properly? 2. Is there a memory leak? 3. What is going on in this memory profile? 4. Is it (relatively) normal?
Thanks in advance.
UPDATE
So, I tried Sean's tips, and found some new interesting things.
The session listener works great, and has been instrumental in analyzing this scenario. Something else, that I forgot to mention is that the app's load is only really confounded by a single page, which reaches a functional complexity on an almost comical proportion. So, in testing, I sometimes aim to hit that page, and other times I avoid it. So in my next round of tests, this time using the session listener I found the following:
1) Hit the app with several dozen clients, just visiting a simple page. I noted that the sessions were all released as expected after the specified time limit, and the memory was released. Same thing works perfectly with a trivial number of clients, for the complex case, hitting the 'big' page.
2) Next, I tried hitting the app with the complex use case, with several dozen clients. This time, several dozen more sessions were initiated than expected. It seemed like every client initiated between one and three sessions. After the session expiration time, a little memory was released, but according to the session listener, only about a third of the sessions were destroyed. Contradicting that though, the folder which actually contains the sessions data is empty. Most of the memory that was used is being held, too. But, after exactly one hour of running the stress test, the garbage collector runs and everything is back to normal.
So, follow up questions include:
1) Why might the sessions be handled properly in the simple case, but when things get memory intensive, they stop being managed correctly? Is the Session handler misreporting things, or does using JMeter impact this in some way?
2) Why does the garbage collector wait one hour to run? Is there a system setting that mandates that the garbage collector MUST run within a given time frame, or if there some configuration setting I'm missing?
Thank you again for continued support.
UPDATE 2
Just a quick note: playing around with this some more, I found out the reason I was getting different reports about the number of live sessions is due to the fact that I am using persistent session; if I turn it off, everything works as expected. It indeed says on the Tomcat page for persistent session, that it is an experimental feature. It must be calling sessions events that the listener is picking up on, when one would atypically expect it to do so.