1

Before putting this question i have seen following links

how to use traceview in eclipse for android development?

Android - Can't use traceview

http://developer.android.com/guide/developing/tools/traceview.html

http://developer.android.com/guide/developing/debugging/debugging-tracing.html

Now i am able to generate trace and do method profiling.

But it is still not clear to me how to read the trace and make my code efficient.My application is working so slow.Please guide me

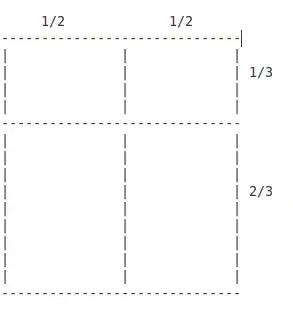
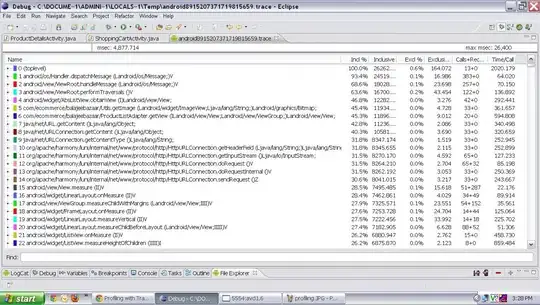
Please see the images also of timeline panel and profile panel enter image description here

enter image description here

Community
  • 1
  • 1
Shruti
  • 1
  • 13
  • 55
  • 95

1 Answers1

2

Looks like You're running the app inside emulator. It should be mentioned that emulator is much slower than actual devices.

Unfortunately, images is not hi-res and I cannot see details, but main thread looks fine without any very long calls.

While doing profiling task I usually look for places suspected to slow down the performance and place Debug.startMethodTracing() and Debug.stopMethodTracing() around that places. E.g. if some Activity is very slow, then place it in OnStart() / OnStop() of the activity. After that, just use Find: traceview line to find Your package class and determine performance bottlenecks.

sandrstar
  • 12,503
  • 8
  • 58
  • 65
  • do i have to write it on .java class or i can do it by using `Start Profiling Method` button – Shruti Nov 23 '11 at 07:24
  • Doing in the code seems to be more precise. However, in some cases (e.g. observed that list scrolling is slow) it might be easier to use DDMS buttons. – sandrstar Nov 23 '11 at 08:02