8

Possible Duplicate:
Oracle: is there a tool to trace queries, like Profiler for sql server?

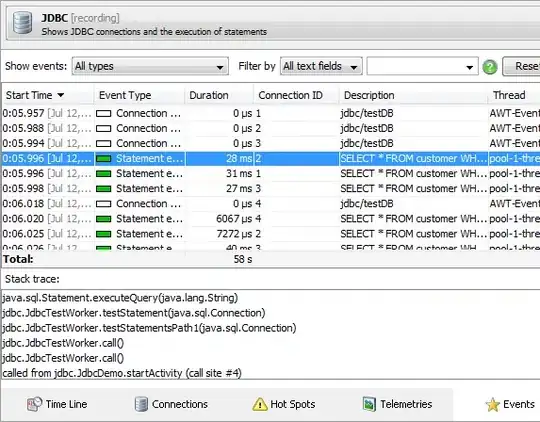
I am using JDBC to talk to Oracle. Are there any ways or external tools that I can track all SQL queries submitted to Oracle DB server from app server during one session? This should be very great debug / bug tracking tool.

Community
  • 1
  • 1
C.c
  • 1,905
  • 6
  • 30
  • 47
  • 1
    To casperOne: Why did you think this is exact duplication. I just cannot understand. My question is mainly focused how to track all SQL queries submitted by client. so I want a list of SQL queries during a explicate period time. but the link you indicated this question is duplication with is mostly focused how to get query plan or else for a specific query. – C.c Nov 28 '11 at 06:45

4 Answers4

6

You can use JDBC (Enabling and Using JDBC Logging) logging feature.

KV Prajapati
  • 93,659
  • 19
  • 148
  • 186
4

You can try JProfiler. Its JDBC probe shows you all SQL statements in the events view:

enter image description here

It works for all JDBC drivers, including Oracle's. Also, the hot spots view of the probe is useful to determine which queries take most of the time.

Disclaimer: My company develops JProfiler

Ingo Kegel
  • 46,523
  • 10
  • 71
  • 102
  • Great, Thank you and your team, Do I need purchase a lience for this software? – C.c Nov 26 '11 at 09:23
  • @user872501 If you want to keep using it after the evaluation period, you would have to purchase a license. – Ingo Kegel Nov 26 '11 at 20:05
  • I just tried this... You can't see the actual parameters being passed though can you? I want to see all the actual queries that are run. – Matt Broekhuis Feb 01 '12 at 17:42
  • 1
    @MattBroekhuis Open the session settings, go to the "JEE & Probes" section, select the JDBC probe and select "Resolve parameters of prepared statements". – Ingo Kegel Feb 02 '12 at 09:31
1

Try this http://code.google.com/p/log4jdbc/

aldrin
  • 4,482
  • 1
  • 33
  • 50
  • Thank you, Just have a look seems this tool need to be embedded to app codes, Do you have a tool which is fully out of application box – C.c Nov 25 '11 at 05:58
  • @user872501 no i dont. you could consider AVD's suggestion and see if it fits your needs – aldrin Nov 25 '11 at 07:33
1

You can check the V$SQLAREA view to see everything a connection sent to the server:

select sql_fulltext,
       executions,
       buffer_gets,
       rows_processed,
       elapsed_time,
       first_load_time,
       last_active_time
from v$sqlarea 
where parsing_schema_name = 'YOUR_DB_USERNAME'

The view also contains information about how often the stament was executed and other interesting information that might be useful to track down performance problems.

Note that the information is basically a cache - so statements might be cleared from the global area in a very busy system (which means that there is a chance that you do not really see all statements)