Changing font faces and sizes works well without expression in the labels. Here is the code where I've problem to change the font faces in label expression.
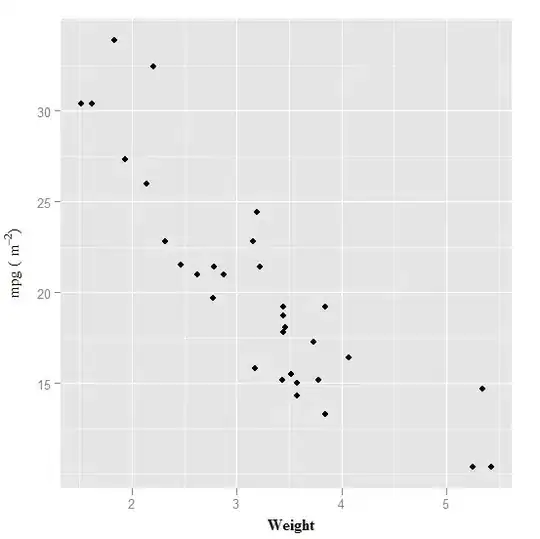
p <- ggplot(data = mtcars, aes(x=wt, y=mpg)) +
    geom_point() +
    labs(x="Weight", y=expression(paste("mpg (  ", m^{-2}, ")"))) +
    theme(axis.title.x = element_text(family="serif", face="bold",
        size=12, angle=00, hjust=0.54, vjust=0)) +
    theme(axis.title.y = element_text(family="serif", face="bold",
        size=12, angle=90, vjust=0.25))

p
Any help would be highly appreciated. Thanks