18

This question is looking for a practical and easy way for drawing multigraphs using Javascript.

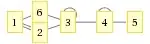
First of all look at this question. None of those libraries support Multigraphs (or Pseudographs ). I mean I can't generate graphs like this:

Some Multigraph

Is there any jQuery plugin (or javascript library) out there for this purpose ?

I thought i can use WolframAlpha's API and use its images, something like this:

enter image description here

but it have lots of problem:

  1. I can't move nodes or add remove edges interactively.

  2. Only 2000 API calls per month. Not enough.

  3. I can't produce large or intermediate graphs.

  4. They are really ugly!

Please help me if you know some javascript library in order to draw Multigraphs, or anyway to produce such graphs (something like Dracula Graph Library but with ability to draw Multigraphs).

Michel Gokan Khan
  • 2,525
  • 3
  • 30
  • 54

10 Answers10

12

Cytoscape.JS supports multigraphs, is pure Javascript, and uses the new HTML 5 Canvas for performance. Its design intent is general purpose graph visualization/manipulation.

https://js.cytoscape.org/

Michel Gokan Khan
  • 2,525
  • 3
  • 30
  • 54
Developer
  • 306
  • 3
  • 4
5

If you are allowed to use Google Charts API you may refer to this

http://code.google.com/apis/chart/image/docs/gallery/graphviz.html

Example:

https://chart.googleapis.com/chart?cht=gv&chl=graph{C_0--H_0[type=s];C_0--H_1[type=s];C_0--H_2[type=s];C_0--C_1[type=s];C_1--H_3[type=s];C_1--H_4[type=s];C_1--H_5[type=s]}

graph

Helder Pereira
  • 5,522
  • 2
  • 35
  • 52
Prashant Bhate
  • 10,907
  • 7
  • 47
  • 82
  • 2
    @parashant-bhate: great suggestion. it supports Multigraphs too. It will be perfect if I could make it more interactive. Like click over nodes in order to delete them or move node or delete edges by clicking over them. thanks again – Michel Gokan Khan Nov 29 '11 at 10:11
3

I'm affraid you will have to do some development yourself. Raphael.js is pretty capable in creating and manipulating svg - would be good starting point

Konstantin Pribluda
  • 12,329
  • 1
  • 30
  • 35
3

Some of those graph visualization libraries (mentioned in this question) DO support Multigraphs and allow dragging/placement of nodes

jsplumb: http://jsplumb.org/jquery/stateMachineDemo.html

possibly http://js-graph-it.sourceforge.net/ may support multigraphs.

but as far as your issue

4- Its really ugly!

These may not appeal to your aesthetic.

Community
  • 1
  • 1
Nate-
  • 157
  • 1
  • 9
2

I think paper.js (http://paperjs.org) will get you also pretty close.

tmaximini
  • 8,403
  • 6
  • 47
  • 69
2

You might want to check this one out: www.d3js.org

You'd have to do a lot yourself (make your own SVG and such), but the library is very powerful.

cantdutchthis
  • 31,949
  • 17
  • 74
  • 114
1

In a commercial scenario, take a look at yFiles for HTML:

It easily supports multi-graphs and does not look too ugly, I believe:

Multi-graphs - laid out automatically using yFiles for HTML

(These graphs have been laid out automatically, manual placement is also possible.)

Of course this is a matter of taste, so if you don't like the look, you can change any aspect of the visualization, like in the style tutorial.

The API offers full interactive editing capabilities and being a pure client-side solution, of course there is no API call count limit.

Large graphs are still a problem with todays' Javascript engines, but only if "large" means more than thousands of elements. With virtualization (considering only what is currently visible in the viewport during rendering), you can get good performance with thousands of elements.

Disclaimer: I work for the company that creates the library, on SO/SE, however I do not represent my employer. My posts and comments are my own.

Sebastian
  • 7,729
  • 2
  • 37
  • 69
1

You can check jsnetworkx (http://jsnetworkx.org/)

It is a js version of python graph library which supports multi-graph. It has a draw function which visualizes the graph using D3.js. It is available for both browser and node.js.

Mark Jin
  • 2,616
  • 3
  • 25
  • 37
1

I recently used Graphviz to draw the connections between some authors pubblications. Graphviz is open source graph visualization software. The Graphviz layout programs take descriptions of graphs in a simple text language, and make diagrams in useful formats, such as images and SVG for web pages, PDF or Postscript for inclusion in other documents; or display in an interactive graph browser.

For example i used a simple DOT file to write all the connection between the authors and I produced a PNG file.

http://www.graphviz.org/

Here there is all the documentation that you need and in the gallery section you can see a lot of output example.

Hoping it could be helpful.

andreapavan
  • 697
  • 1
  • 7
  • 24
0

Best bet would be to render them on the server (or use it as an applet) with JGraphT.

Jan Jongboom
  • 26,598
  • 9
  • 83
  • 120
  • 1
    i want a "javascipt" library ... JGraphT is a Java library. – Michel Gokan Khan Nov 29 '11 at 10:03
  • I know, but there are no javascript libraries for that. As you already pointed out that you might just wanted to use Wolfram API which spits out images, this could be a viable solution. – Jan Jongboom Nov 30 '11 at 10:29
  • I don't know why I'm insist not to use flash or applets ... now I'm working on @Konstantin's solution and do the development by myself. Of course after finishing development I'll make it fully open source. Thanks anyway. – Michel Gokan Khan Nov 30 '11 at 14:42