I'm trying to fix some JavaScript bugs. Firebug makes debugging these issues a lot easier when working in Firefox, but what do you do when the code works fine on Firefox but IE is complaining?
Asked
Active
Viewed 4.5k times
44
-
1See also [Javascript Troubleshooting Tools In IE](http://stackoverflow.com/questions/3404/javascript-troubleshooting-tools-in-ie), a similar question that was asked recently. – Patrick McElhaney Aug 12 '08 at 00:52
16 Answers
23
you can also check out the IE Developer Toolbar which isn't a debugger but will help you analyze the contents of your code.
Visual Studio will help with the debugging
Fiddler should help analyse the traffic travelling to and from your browser
-
Updated link for IE Developer Toolbar: http://www.microsoft.com/downloads/en/details.aspx?FamilyID=95e06cbe-4940-4218-b75d-b8856fced535 – kg. Nov 11 '10 at 21:40
-
Although these are arguably the best tools for IE, they're still garbage compared to Firebug. The inability to right-click on an element an inspect it's DOM and CSS alone makes all these tools nearly worthless. – Cerin Jul 24 '13 at 17:28
13
You can try Firebug Lite or use Visual Studio to debug the JavaScript.
Lance Fisher
- 25,684
- 22
- 96
- 122
11
Since Internet Explorer 8, IE has been shipping with a built-in tool-set for debugging, troubleshooting, and generally helping in development of your pages/applications. You can access these tools by pressing F12 while in the browser.
HTML Tab
The HTML tab will let you peek into the DOM as the browser understands it. As you select elements from the HTML view, their styles will be detailed on the right, with individual rules have the ability to be toggled on and off. You can also modify rules, and determine whether the styles on the element were inherited, or assigned explicitly. Additionally, you can even tell which .css file they originate from.
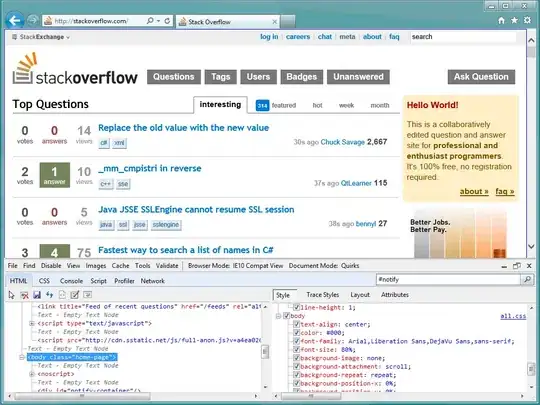
There is a bit more you can do in the HTML tab, such as review and modify attributes on elements, and even make changes to the layout of the element from within the layout section. Additionally, you can make changes directly to the markup to quickly test out some structural ideas.
Script Tab
For resolving JavaScript issues, you can watch the Console and the Script Tag. If your script stumbles across an a call to an undefined method, you'll be alerted within your console. The console also lets you run arbitrary JavaScript against your page, if you want to toggle items on or off, or try bind a handler to a button.
The Script tab great as well as it will format your JavaScript for you, allow you to insert breakpoints, step in and over code blocks, and watch variables over time.

If you've used Firebug, or even the Webkit Inspector, the F12 Developer Tools in Internet Explorer 8+ should be pretty familiar to you.
-
-
@Jon It's true that the F12 Developer Tools have left much to be desired, but they were pretty powerful when properly utilized. IE11 ships with a brand new set of tools too, which are both aesthetically revitalized and even more powerful than before. – Sampson Oct 08 '13 at 19:36
-
-
@Jon What is it you're trying to do that you find difficult with the IE11 Developer Tools? – Sampson Oct 09 '13 at 15:31
-
IE11 isnt production yet. Im using 10, and on the fly css changes is absolutely terrible – Jon Oct 15 '13 at 13:44
-
@Jon What, specifically, are you frustrated with? I'm doing a talk on the developer tools later this year and would love to know your experience. – Sampson Oct 15 '13 at 19:57
-
Specifically I had a css issue on IE only. So I wanted to play around live with the css so I could see which rules I should change to fix it. It was a button that appeared only on hover. The firebug style:hover I couldnt find. So had to work through the code to find the classes, and the css is not listed as a cascade, so I had to scroll through entire css and when I changed it, to hover to see effect. But I couldnt even change the css. And then repeat. Pins in eyes. I guess try something like that on both and compare yourself. – Jon Oct 16 '13 at 12:20
-
got 8.1 with IE11 & yes the dev tool is much better. Still cant see how to look at only hover, and where did view other IE versions go? My hack didnt work on IE11, nor does IE11 read css properly if every other browser is anything to go by. – Jon Oct 17 '13 at 17:29
-
@Jon You can view other IE versions (remember, this is emulation, and not always 100% accurate) in the Emulation Panel (Ctrl+8). As for reading CSS properly, IE attempts to follow the specifications rather than the other browsers - if you come across a place where IE is improperly interpreting your CSS, please let me know. I'd love to work with you in documenting those examples, and finding work-arounds or filing bugs. – Sampson Oct 18 '13 at 23:20
-
ctrl+8 - super thanks. That looks like a great tool. Just on the basis that the css works i other browsers, and they also follow the rules, its probably explorer out, but I could be wrong. What do you do that you want to document examples of explorer not working? – Jon Oct 20 '13 at 17:15
-
@Jon I'm a web-developer who loves solving cross-browser compat issues. Additionally, I'm an IE User Agent, meaning I volunteer to assist web-developers make their projects work in Internet Explorer, and routinely speak with Microsoft engineers to improve their products. – Sampson Oct 28 '13 at 03:17
6
Firebug lite doesn't work too well for me. The Developer Toolbar just isn't good enough. There really is no great solution.
EndangeredMassa
- 17,208
- 8
- 55
- 79
2
For the DOM Inspector, try the Internet Explorer Developer Toolbar.
For the Net tab, try Fiddler.
For Javascript debugging, try Visual Web Developer 2008 Express Edition. (Or a higher edition of Visual Studio)
Also, try DebugBar.
SLaks
- 868,454
- 176
- 1,908
- 1,964
1
Visual Studio 2008 can do JavaScript debugging, you have to go to IE's Tools->Internet Options->Advanced and uncheck 'Disable Script Debugging (Internet Explorer)' in order for the browser to bubble up the errors it detects.
Once you're in Visual Studio you basically have it's entire debugging arsenal at your disposal. It's not as integrated as Firebug, but it is way better than anything we used to have.
Wally Lawless
- 7,539
- 7
- 37
- 53
1
i think it is better that you first install the ie core addon in firefox then load the page with ie addon and press f12. good luck.
Farhan
- 96
- 2
- 11
1
Make a bookmark in the favourites bar, and put this address as the URL:
javascript:(function(F,i,r,e,b,u,g,L,I,T,E){if(F.getElementById(b))return;E=F[i+'NS']&&F.documentElement.namespaceURI;E=E?F[i+'NS'](E,'script'):F[i]('script');E[r]('id',b);E[r]('src',I+g+T);E[r](b,u);(F[e]('head')[0]||F[e]('body')[0]).appendChild(E);E=new%20Image;E[r]('src',I+L);})(document,'createElement','setAttribute','getElementsByTagName','FirebugLite','4','firebug-lite.js','releases/lite/latest/skin/xp/sprite.png','https://getfirebug.com/','#startOpened');
Then navigatge to the page you want and click the link. Firebug Lite will/should open up...
Jon
- 6,437
- 8
- 43
- 63
0
I found a solution to this problem, you could simply stick this tag to the page you are trying to debug and it will open firebug:
<script type="text/javascript" src="https://getfirebug.com/firebug-lite.js"></script>
Explanation from https://getfirebug.com/firebuglite#Stable
7dr3am7
- 755
- 1
- 8
- 21
0
I'm guessing this question was posted before the IE8 final came out, according tho some of the answers.
These days, IE8's inbuilt Developer Tools are great; and while the JS debugging isn't as useful as Visual Studio the Dev Tools in general much better than Firebug in my opinion. Between that and the Compatibility View Browser Mode I can handle all my IE6 development needs.
Coxy
- 8,844
- 4
- 39
- 62
-
No, I completely disagree because the compatibility mode doesn't work. At work we tried to use IE9 with compatibility mode set to IE8 and it wouldn't behave as IE8 for the most important aspect that we were dealing with. I don't think that the developer tool is better than Firebug, but it's different. – 7dr3am7 Oct 02 '12 at 08:00
0
If you're a serious Front-end Developer, give AJAX Edition a test run:
http://www.compuware.com/application-performance-management/ajax-performance-testing.html
It's a free tool that allows users’ to understand what is causing performance and functional-related problems in modern AJAX/web Applications.
Matt Zanderigo
- 11
- 1
0
In IE, go to MenuBar->Tools Select Debugger Tools Hit F12 and enjoy. It is far from Fire Bug, but suitable for some quick help
Sergey T
- 161
- 1
- 6
0
There is always a way how to get around this issue, watch the video and you will be able to install firebug in 2 mins.
Good luck
Community
- 1
- 1
Digital site
- 4,431
- 12
- 48
- 72
-
1Note that link-only answers are discouraged, SO answers should be the end-point of a search for a solution (vs. yet another stopover of references, which tend to get stale over time). Please consider adding a stand-alone synopsis here, keeping the link as a reference. – kleopatra Jul 28 '13 at 20:13
0
The IE8 beta comes with what I think is the IE Developer toolbar, but it seems to be a lot more powerful than the last time I tried the toolbar on IE7
Orion Edwards
- 121,657
- 64
- 239
- 328