24

I'm exploring memory usage in Java to understand why my program leaks memory. After stripping off code in my main while loop, I still get an increase of memory usage over time. Pondering the memory usage of an empty program:

class Nothing
{    public static void main(String[] args)
     {    while(true);    }
}

I still saw an increase of memory:

Image description here

So my question is: Why is there still a saw tooth pattern? Why when the GC runs does it not save all the memory (each time the gc runs (the valleys) the used memory increases by 10-20Kb (compared to the previous valley))?

EDIT:

java version "1.6.0_29"

Java(TM) SE Runtime Environment (build 1.6.0_29-b11)

Java HotSpot(TM) Client VM (build 20.4-b02, mixed mode, sharing)

OS: Windows 7 Enterprise-32 bit
GoldfishGrenade
  • 621
  • 1
  • 6
  • 14
  • I don't see an increase. The memory goes up, then collects down. It looks like the maximum memory used is constant over time. – Steve Kuo Dec 03 '11 at 00:23
  • Yet another tool to try finding memory leak in your application is [Plumbr](http://plumbr.eu). It should be much easier than wrestling with profilers and trying to deduce something from all that information. – Nikem Dec 05 '11 at 12:08

2 Answers2

11

Why is there still a saw tooth pattern?

If I'm not mistaken, part of the reason for this is that the monitor itself is forcing the application to create temporary objects that contain information about the state of garbage-collection and memory usage.

Why when the GC runs does it not save all the memory (each time the gc runs (the valleys) the used memory increases by 10-20Kb (compared to the previous valley))?

I believe the monitor does not instantly see the amount of used memory after garbage-collection, but rather, must poll frequently to see memory usage. Therefore, the perceived "valley" is necessarily somewhat higher than the true valley. I would guess that the perceived increase in memory usage at the valleys is just a random artifact of this discrepancy, and would be neutralized over time. (That is, I don't think that there's actually 10-20 KB of memory leak occurring in each cycle.)

ruakh
  • 175,680
  • 26
  • 273
  • 307
  • 1
    So how would I go about getting a more accurate picture of what's happening under the hood? – GoldfishGrenade Dec 02 '11 at 21:38
  • In a real program, or in your no-op-while-loop test program? In a real program a heap-dump will help you figure out what kind of object is failing to be garbage-collected, which can help you figure out what part of your program might be to blame. – ruakh Dec 02 '11 at 21:42
  • 1
    +1 This is absolutely caused by the management beans and whatever protocol used to talk to them (probably RMI as it is the default). – Fredrik Dec 02 '11 at 21:47
  • So would it be better to look at it through Task Manager > Resource Monitor ? – GoldfishGrenade Dec 02 '11 at 21:50
  • 1
    That won't give you very much information. I think the tool that you're using is probably going to be useful; you just can't expect it to have *zero* effect on your program. If you're looking for memory leaks in a program that actually has them, the profiler's own effect will be miniscule by comparison. By removing *all* memory-allocations from your test program, you created a situation where the profiler's own effect is the *only* thing you're seeing -- which is the opposite of useful. – ruakh Dec 02 '11 at 21:54
5

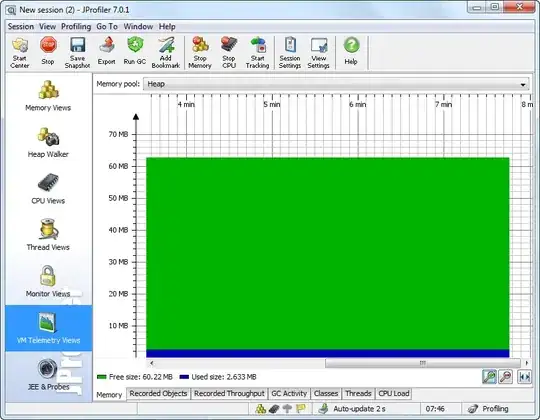
This is an artifact by the profiler, without the profiler there will be no allocations. Different profilers produce different artifacts, depending on how they record data. Below you see what profiling Nothing JProfiler will look like:

enter image description here

Much less of a sawtooth pattern. However, there is also a minuscule memory consumption:

enter image description here

which is due to the fact the profiling agent polls the java.lang.management.MemoryUsage JMX bean. Eventually this consumption will also trigger a garbage collection.

Ingo Kegel
  • 46,523
  • 10
  • 71
  • 102