3

I recently discovered that Delphi has a global variable called ReportMemoryLeaksOnShutdown, when set to True will detect Memory leaks when the Application closes. I found that information from reading some comments on another related question: What is the best tool to detect memory leaks in Delphi

So from the Project Source I put ReportMemoryLeaksOnShutdown := True;

Now when my Application is closed it is picking up a lot of Memory leaks. My immediate thought is to check that created Objects are freed correctly (try..finally..free etc).

I have gone over the code and I cannot see where the leaks could be coming from, and now I need to find them, because if Memory leaks are reported when the Application is exited then that very much means there are Memory leaks at runtime, which will grow in size and is bad!

From the the link above 3rd party tools were recommended such as Eureka Log. Is there a way using just the IDE and debugger to help me find and fix the problem areas?

UPDATE

I managed to get rid of about 6 memory leaks, I discovered it was to do with MDI Childs. The childs are holding some pointer data in listboxes, and when the main Application is closing, it was not freeing the childs correctly, that is now fixed.

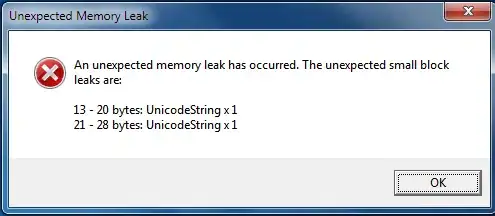
I am now left with these 2 errors:

enter image description here

I found this post http://fgaillard.com/2011/02/when-the-debugger-leaks/ which may suggest the debugger is at fault with my above error?

Community
  • 1
  • 1
  • Maybe there are not a reall leak but some static objects you allocated before are still in memory while application go to close. – AlexTheo Dec 04 '11 at 11:44
  • 5
    Read [how-to-get-a-stack-trace-from-fastmm](http://stackoverflow.com/questions/1130454/how-to-get-a-stack-trace-from-fastmm). – LU RD Dec 04 '11 at 11:54
  • The first thing to note is that you don't need to worry about TComponent-based objects (including controls) if they are created always passing a Parent Control to the constructor. Delphi takes care of releasing these for you. If you have any TPersistent or TObject descendants, however, you need to release these manually. The leak report dialog SHOULD tell you the class names responsible for the leakages! – LaKraven Dec 04 '11 at 12:07
  • If you have Delphi XE Architect or Enterprise, or XE2 Arch/Ent editions, you have AQTime which has an even better leak location technology than FastMM, including a nice GUI that will make a visual list and take you to your leaks with a single click. – Warren P Dec 04 '11 at 13:41
  • 1
    I only ever see the UnicodeString leaks when the Application has an Access Violation at close which never displays (essentially the application doesn't exit properly, it forces itself closed supressing the Access Violation message). Check to make sure you aren't freeing objects that are already freed! This is a common cause from my experience! – LaKraven Dec 04 '11 at 15:52
  • yes, the debugger leaks UnicodeStrings. It's a bit annoying! – David Heffernan Dec 04 '11 at 16:22
  • 2
    I think it leaks strings from tooltips. No matter. Run without the debugger and if you still see these leaks then they are real. – David Heffernan Dec 04 '11 at 17:02
  • So the UnicodeString leaks are coming from the debugger. Well I have gone through most my code and I always use the try..finally.free blocks, in fact when I create an Object I write the AObject.Free immediately. @DavidHeffernan I dont think I should be worried too much about the Unicode string leaks then if they are from the debugger. Thanks for the information, I wouldn't of guessed it came from the tooltips :) –  Dec 04 '11 at 23:25
  • The string leaks might be from the debugger. But if you get the leaks when the debugger is not active then the leaks are yours. I never said that your string leaks are definitely from the debugger. – David Heffernan Dec 05 '11 at 05:05

2 Answers2

19

First, make sure you get the full version of FastMM. It has some additional capabilities, such as FullDebugMode, which will help you here. Rebuild your project with the FullDebugMode and 'LogMemoryLeaksToFile' settings defined in the compiler options, and the FullDebugMode DLL in the same folder as your EXE. This will produce a file with detailed information on your memory leaks at program shtudown, in addition to the dialog box. The most useful information here will be a partial stack trace of each allocation.

Once you have this information, you can start fixing memory leaks. There's a bit of a trick to this: Remember that object ownership generally looks a lot like a tree: One object owns other objects, which each own other objects, and so on. So what you want to look for first is the leak type with the smallest number of leaks, since that's likely to be the root of the tree.

For example, if the report says you're leaking one TObjectList and 1000 TMyObject instances, it's likely that those TMyObject instances are assigned to the list and you just forgot to free the list. Fixing that would clear the whole report, so don't go hunting around for the individual child objects until you've ruled out other things.

Mason Wheeler
  • 82,511
  • 50
  • 270
  • 477
7

The best way to do this is to get the tool to tell where where the allocation was made that led to a leak. To do this you need to download and use the full version of FastMM. The version supplied with Delphi does not have that capability.

When using the full FastMM, a report will be produced with all the gory details you need, including stack traces, to tell you what piece of code leaked.

David Heffernan
  • 601,492
  • 42
  • 1,072
  • 1,490