I am trying to match boxplot's outliers color to the fill color which is set by aesthetic (scale_colour_discrete).
Here is an example.
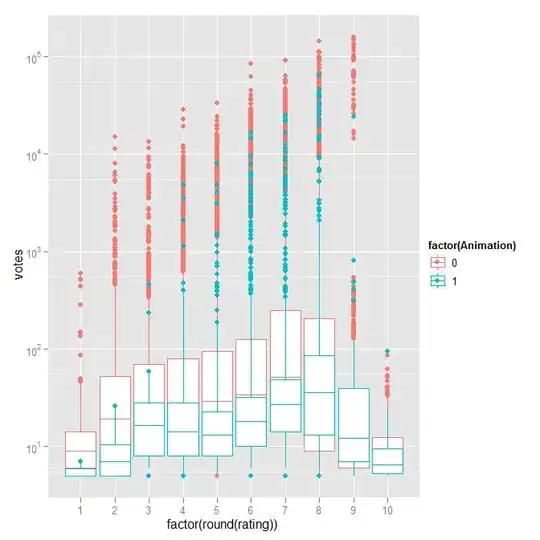
m <- ggplot(movies, aes(y = votes, x = factor(round(rating)),
    fill=factor(Animation)))
m + geom_boxplot() + scale_y_log10()
This generates plot below. How do I change those black dots to be reddish/greenish colors used in the body? outlier.colour option of the boxplot seems to pick one colour across, and not as aesthetic, if I understand correctly. I dont mind using colour aesthetics if that helps.

Edit:
Adapted this solution (Changing whisker definition in geom_boxplot). The horizontal dodging is reset by stats_summary and I couldn't figure out how to get it back. I'd ptobably drop outliers and stretch whiskers as needed since I know how now.
# define the summary function
f <- function(x) {
  r <- quantile(x, probs = c(0.05, 0.25, 0.5, 0.75, 0.95))
  names(r) <- c("ymin", "lower", "middle", "upper", "ymax")
  r
}
# define outlier function, beyound 5 and 95% percentiles
o <- function(x) {
  subset(x, x < quantile(x,probs=c(0.05))[1] | quantile(x,probs=c(0.95))[1] < x)
}

m <- ggplot(movies, aes(y = votes, x = factor(round(rating)),
    colour=factor(Animation)))
m <- m + stat_summary(fun.data=f, geom='boxplot')
m <- m + stat_summary(fun.y=o, geom='point', aes(colour=factor(Animation)))
m + scale_y_log10()
