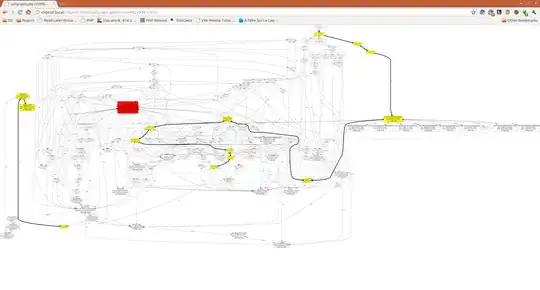
I want get full graph of my script using KCacheGrind, it this possible?
Asked
Active
Viewed 1,488 times
-1
-
What do you mean with *full*? If you select the `main (100%)` root branch, KCacheGrind should show you the full graph... – lorenzo-s Dec 20 '11 at 14:57
1 Answers
2
Have a look at:
I would suggest using xhprof for its better Call-Graph and data presentation.
Check this link there are 2 screenhots in the XHGui section: Profiling a PHP Application
Here is a screenshot of the CallGraph from the above link:

(source: erichogue.ca)
Although, XHProf does not provide full backtrace. XHProf keeps track of only one level of calling context and is therefore only able to answer questions about a function looking either one level up or down.
Glorfindel
- 21,988
- 13
- 81
- 109
ThinkingMonkey
- 12,539
- 13
- 57
- 81