8

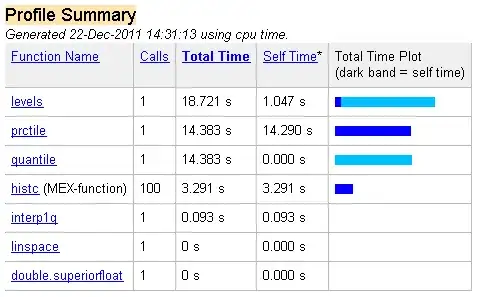
I have a MATLAB routine with one rather obvious bottleneck. I've profiled the function, with the result that 2/3 of the computing time is used in the function levels:

enter image description here

The function levels takes a matrix of floats and splits each column into nLevels buckets, returning a matrix of the same size as the input, with each entry replaced by the number of the bucket it falls into.

To do this I use the quantile function to get the bucket limits, and a loop to assign the entries to buckets. Here's my implementation:

function [Y q] = levels(X,nLevels)
% "Assign each of the elements of X to an integer-valued level"

p = linspace(0, 1.0, nLevels+1);

q = quantile(X,p);
if isvector(q)
    q=transpose(q);
end

Y = zeros(size(X));

for i = 1:nLevels
    % "The variables g and l indicate the entries that are respectively greater than
    % or less than the relevant bucket limits. The line Y(g & l) = i is assigning the
    % value i to any element that falls in this bucket."
    if i ~= nLevels % "The default; doesnt include upper bound"
        g = bsxfun(@ge,X,q(i,:));
        l = bsxfun(@lt,X,q(i+1,:));
    else            % "For the final level we include the upper bound"
        g = bsxfun(@ge,X,q(i,:));
        l = bsxfun(@le,X,q(i+1,:));
    end
    Y(g & l) = i;
end

Is there anything I can do to speed this up? Can the code be vectorized?

Shai
  • 111,146
  • 38
  • 238
  • 371
Chris Taylor
  • 46,912
  • 15
  • 110
  • 154

5 Answers5

4

If I understand correctly, you want to know how many items fell in each bucket. Use:

n = hist(Y,nbins)

Though I am not sure that it will help in the speedup. It is just cleaner this way.

Edit : Following the comment:

You can use the second output parameter of histc

[n,bin] = histc(...) also returns an index matrix bin. If x is a vector, n(k) = >sum(bin==k). bin is zero for out of range values. If x is an M-by-N matrix, then

Andrey Rubshtein
  • 20,795
  • 11
  • 69
  • 104
  • No, I want to know *which bucket the items fell into*. For example, with the input vector (3, 1, 4, 6, 7, 2), if I ran my `levels` function on it with `nLevels=2` I would expect to see the output (1, 1, 2, 2, 2, 1). – Chris Taylor Dec 22 '11 at 11:33
  • That's great, thanks! I had to write a loop over the columns so that each column is treated individually, but this seems to be performing much better. I'll update my answer with the details. Have upvoted. – Chris Taylor Dec 22 '11 at 14:33
2

I think you shoud use histc

[~,Y] = histc(X,q)

As you can see in matlab's doc:

Description

n = histc(x,edges) counts the number of values in vector x that fall between the elements in the edges vector (which must contain monotonically nondecreasing values). n is a length(edges) vector containing these counts. No elements of x can be complex.

Oli
  • 15,935
  • 7
  • 50
  • 66
  • I must have been unclear. I want to know which bucket each entry in my input falls into. For example, if I give the inputs `x=[3 1 4 6 7 2]` and `nLevels=2` I would expect to see the output `[1 1 2 2 2 1]` because the 1st, 2nd and 6th entries fall in the first bucket (i.e. the smallest half, since we only have 2 buckets) and the others fall into the second bucket. – Chris Taylor Dec 22 '11 at 11:36
2

How About this

function [Y q] = levels(X,nLevels)

p = linspace(0, 1.0, nLevels+1);
q = quantile(X,p); 
Y = zeros(size(X));
for i = 1:numel(q)-1    
    Y = Y+ X>=q(i);
end

This results in the following:

>>X = [3 1 4 6 7 2];
>>[Y, q] = levels(X,2)

Y =

     1  1  2  2  2  1

q =

     1  3.5  7

You could also modify the logic line to ensure values are less than the start of the next bin. However, I don't think it is necessary.

Aero Engy
  • 3,588
  • 1
  • 16
  • 27
  • This puts the entries of the whole matrix into buckets, but doesn't do the columns individually. However, you have given me an idea to speed up my code - I'll let you know if it works! – Chris Taylor Dec 22 '11 at 13:54
  • @ChrisTaylor I missed the part in your question where it was suppose to operate on each column. It shouldn't be difficult to modify the above to function that way. Let me know if you need more help. – Aero Engy Dec 22 '11 at 14:09
  • Thanks, I used your idea of adding on an array of logicals at each stage of the loop in my own answer (below). It's given me a decent speedup, so I'm very grateful! Have upvoted. – Chris Taylor Dec 22 '11 at 14:11
  • You are welcome. I was going to suggest using a repmat of the corresponding i-th row of the martrix q inside of the loop to do the >=q test. X>=repmat(q(i,:),size(X,1),1); However, I was unfamiliar with bsxfun() and it seems to take care of that all on its own. – – Aero Engy Dec 22 '11 at 15:14
1

I made a couple of refinements (including one inspired by Aero Engy in another answer) that have resulted in some improvements. To test them out, I created a random matrix of a million rows and 100 columns to run the improved functions on:

>> x = randn(1000000,100);

First, I ran my unmodified code, with the following results:

enter image description here

Note that of the 40 seconds, around 14 of them are spent computing the quantiles - I can't expect to improve this part of the routine (I assume that Mathworks have already optimized it, though I guess that to assume makes an...)

Next, I modified the routine to the following, which should be faster and has the advantage of being fewer lines as well!

function [Y q] = levels(X,nLevels)

p = linspace(0, 1.0, nLevels+1);
q = quantile(X,p);
if isvector(q), q = transpose(q); end

Y = ones(size(X));

for i = 2:nLevels
    Y = Y + bsxfun(@ge,X,q(i,:));
end

The profiling results with this code are:

enter image description here

So it is 15 seconds faster, which represents a 150% speedup of the portion of code that is mine, rather than MathWorks.

Finally, following a suggestion of Andrey (again in another answer) I modified the code to use the second output of the histc function, which assigns entries to bins. It doesn't treat the columns independently, so I had to loop over the columns manually, but it seems to be performing really well. Here's the code:

function [Y q] = levels(X,nLevels)

p = linspace(0,1,nLevels+1);

q = quantile(X,p);
if isvector(q), q = transpose(q); end
q(end,:) = 2 * q(end,:);

Y = zeros(size(X));

for k = 1:size(X,2)
    [junk Y(:,k)] = histc(X(:,k),q(:,k));
end

And the profiling results:

enter image description here

We now spend only 4.3 seconds in codes outside the quantile function, which is around a 500% speedup over what I wrote originally. I've spent a bit of time writing this answer because I think it's turned into a nice example of how you can use the MATLAB profiler and StackExchange in combination to get much better performance from your code.

I'm happy with this result, although of course I'll continue to be pleased to hear other answers. At this stage the main performance increase will come from increasing the performance of the part of the code that currently calls quantile. I can't see how to do this immediately, but maybe someone else here can. Thanks again!

Chris Taylor
  • 46,912
  • 15
  • 110
  • 154
1

You can sort the columns and divide+round the inverse indexes:

function Y = levels(X,nLevels)
% "Assign each of the elements of X to an integer-valued level"
[S,IX]=sort(X);
[grid1,grid2]=ndgrid(1:size(IX,1),1:size(IX,2));
invIX=zeros(size(X));
invIX(sub2ind(size(X),IX(:),grid2(:)))=grid1;
Y=ceil(invIX/size(X,1)*nLevels);

Or you can use tiedrank:

function Y = levels(X,nLevels)
% "Assign each of the elements of X to an integer-valued level"
R=tiedrank(X);
Y=ceil(R/size(X,1)*nLevels);

Surprisingly, both these solutions are slightly slower than the quantile+histc solution.

cyborg
  • 9,989
  • 4
  • 38
  • 56
  • Thanks, this has got me a small speedup above Andrey's suggestion - now looking at 14 seconds rather than 18 seconds. I'll add the profile results into my answer when I get time. – Chris Taylor Dec 22 '11 at 15:00