I'm trying to achieve a visualization of a specific graph (a Cayley graph of a symmetric permutation group) as the one done here but using Graphviz 2.28 with Dot.

(source: euclideanspace.com)
digraph cayley {
    i -> x [color=red];
    i -> y [color=blue];
    x -> xx [color=red];
    x -> xy [color=blue];
    y -> yx [color=red];
    y -> yy [color=blue];
    xx -> xxx [color=red];
    xx -> xxy [color=blue];
    xy -> xyx [color=red];
    xy -> xyy [color=blue];
    yx -> yxx [color=red];
    yx -> xyx [color=blue];
    yy -> yyx [color=red];
    yy -> yyy [color=blue];
    xxx -> i [color=red];
    xxx -> xxxy [color=blue];
    xxy -> xxyx [color=red];
    xxy -> xxyy [color=blue];
    xyx -> xyxx [color=red];
    xyx -> xxyx [color=blue];
    xyy -> yy [color=red];
    xyy -> xyyy [color=blue];
    yxx -> yxxx [color=red];
    yxx -> xx [color=blue];
    yyx -> xxyy [color=red];
    yyx -> xyxx [color=blue];
    yyy -> yyyx [color=red];
    yyy -> i [color=blue];
    xxxy -> xxxyx [color=red];
    xxxy -> yyx [color=blue];
    xxyx -> yyy [color=red];
    xxyx -> xxxyx [color=blue];
    xxyy -> xyy [color=red];
    xxyy -> yxx [color=blue];
    xyxx -> xyxxx [color=red];
    xyxx -> xxx [color=blue];
    xyyy -> xyyyx [color=red];
    xyyy -> x [color=blue];
    yxxx -> y [color=red];
    yxxx -> xyyyx [color=blue];
    yyyx -> xxy [color=red];
    yyyx -> xyxxx [color=blue];
    xxxyx -> xyyy [color=red];
    xxxyx -> yx [color=blue];
    xyxxx -> xy [color=red];
    xyxxx -> yxxx [color=blue];
    xyyyx -> xxxy [color=red];
    xyyyx -> yyyx [color=blue];
}
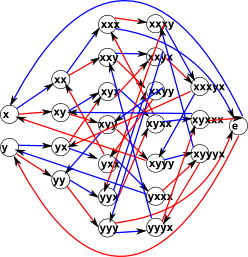
My Dot generates the following layout:  which is a pretty huge graph compared with the previous one. Is there any attribute that can compact the graph as close as possible to the first one ?
