After upgrading to XCode4 (v. 4.2, 4D199) it seems every time my apps crash while debugging, the debugging points to main(), and the stack is unsymbolicated and useless.
This has been working fine for years, I have no idea what has gone wrong.
I'm using GDB. I also tried the LLDB as per this advice, and it didn't work either (similar, useless stack).
My breakpoints work, I get the full stack, and can inspect variables when my code hits those.
Steps to reproduce:
NB. this happens with my own project, but I'll use Apple's code here to remove that variable from the equation
Download the following sample from Apple: https://developer.apple.com/library/ios/#samplecode/UICatalog/Introduction/Intro.html#//apple_ref/doc/uid/DTS40007710
In the
ImagesViewControllerclass, add the following code to theviewDidLoadmethod (so it will crash – we want it to crash for this test):// please note: this code is designed to crash! I want it to crash, to highlight my issue with XCode. NSMutableArray* test = [NSMutableArray new]; [test insertObject:NULL atIndex:0];Then run the app & hit the 'Images' row.
It crashes with a message like:
2011-12-23 14:07:02.788 UICatalog[13394:707] *** Terminating app due to uncaught exception 'NSInvalidArgumentException', reason: '*** -[__NSArrayM insertObject:atIndex:]: object cannot be nil'
*** First throw call stack:
(0x37bbb8bf 0x316a11e5 0x37b1020f 0x699f 0x34fac7ff 0x34fb8c39 0x34fb8aa9 0x34fb898f 0x34fb815b 0x34fb7f53 0x34fac673 0x34fac349 0x66c1 0x35026565 0x3509ece7 0x31aec943 0x37b8fa63 0x37b8f6c9 0x37b8e29f 0x37b114dd 0x37b113a5 0x3768ffcd 0x34fa1743 0x2459 0x2418)
terminate called throwing an exception(gdb)
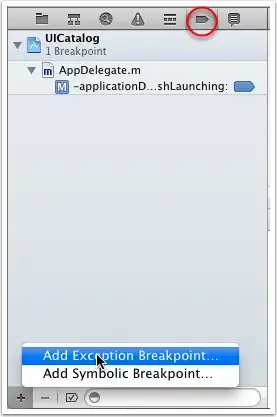
View in xcode: