I have a z function that accepts x and y parameters and returns a z output. I want to plot this in 3d and set the scales. How can I do this easily? I've spent way too much time looking through the documentation and not once do I see a way to do this.
Asked
Active
Viewed 2.2k times
25
1 Answers
34
The plotting style depends on your data: are you trying to plot a 3D curve (line), a surface, or a scatter of points?
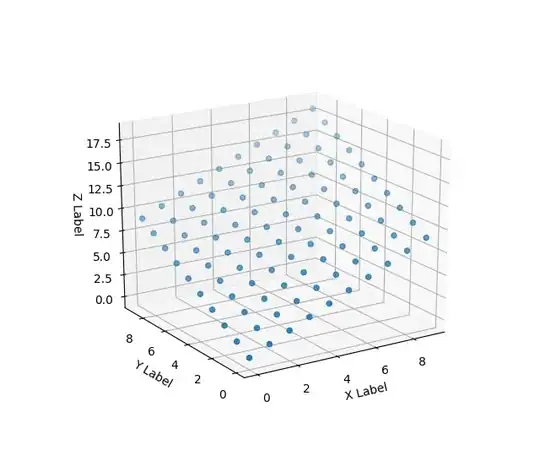
In the first example below I've just used a simple grid of evenly spaced points in the x-y plane for the domain. Generally, you first create a domain of xs and ys, and then calculate the zs from that.
This code should give you a working example to start playing with:
import numpy as np
from mpl_toolkits.mplot3d import Axes3D
import matplotlib.pyplot as plt
import random

def fun(x, y):
    return x + y

fig = plt.figure()
ax = fig.add_subplot(111, projection='3d')
n = 10
xs = [i for i in range(n) for _ in range(n)]
ys = list(range(n)) * n
zs = [fun(x, y) for x,y in zip(xs,ys)]

ax.scatter(xs, ys, zs)

ax.set_xlabel('X Label')
ax.set_ylabel('Y Label')
ax.set_zlabel('Z Label')

plt.show()
For surfaces it's a bit different, you pass in a grid for the domain in 2d arrays. Here's a smooth surface example:
import numpy as np
from mpl_toolkits.mplot3d import Axes3D
import matplotlib.pyplot as plt
import random

def fun(x, y):
    return x**2 + y

fig = plt.figure()
ax = fig.add_subplot(111, projection='3d')
x = y = np.arange(-3.0, 3.0, 0.05)
X, Y = np.meshgrid(x, y)
zs = np.array([fun(x,y) for x,y in zip(np.ravel(X), np.ravel(Y))])
Z = zs.reshape(X.shape)

ax.plot_surface(X, Y, Z)

ax.set_xlabel('X Label')
ax.set_ylabel('Y Label')
ax.set_zlabel('Z Label')

plt.show()

For many more examples, check out the mplot3d tutorial in the docs.
wim
- 338,267
- 99
- 616
- 750
-
For some reason when I change the function, the graph pretty much stays the same? Is there any way to just do a smooth surface? – WhatsInAName Jan 04 '12 at 06:59
-
1For the last graph, is there a way to colour the surface according to z? Say, using a cloropleth? – Luís de Sousa May 31 '16 at 09:56
-
1Why are big `X` and `Y` defined as grid `X, Y = np.meshgrid(x, y)`. Can't we just have `for i in range(size(x)) : for j in range(size(y)) : z[i,j]=f(x[i],y[j]) ` i.e. loop over all small `x & y` and evaluate the function. Then plot with `ax.plot_surface(x, x, z)` – Alexander Cska May 27 '17 at 17:33
-
@WhatsInAName It works just fine. Try `np.sin(x) + np.sin(np.log(y+4))` or something more wavy. – Guimoute Nov 21 '19 at 14:38