37

I tried to use it. And it's really nice for some Plots, but when its about making for example a triangle I found it quite complicated. I figured out how to draw a triangle but how to add that angle marks, those curved lines?

And since I'm beginner into this job, of writing a book, can anyone recommend me which is the best way to accomplish good looking graphics, for example as in the picture below. Which programs are best to use. enter image description here

Thanks for any suggestions and recommendations.

Martin Nycander
  • 1,309
  • 13
  • 29
balboa
  • 951
  • 8
  • 20
  • 7
    Mathematica can definitely make all the graphics that you are showing as examples, but it won't help you make them very easily. You'd need to define your own functions to make it easily to draw things like the angle-arcs. Once this is done it should be easier. I think Mathematica is really good if you need to make your drawings very precise, and you prefer to describe them using program code and equation. (Although it does have interactive editing.) When interactive editing is better, I'd use something like http://zirkel.sourceforge.net/ (for the ones you're showing I'd use Z.u.L, not Mma) – Szabolcs Jan 05 '12 at 19:15
  • 9
    To the closers: This is a perfectly legitimate programming question for the Mathematica tag, since things like graphics for math book are obtained programmatically in Mathematica. – Leonid Shifrin Jan 05 '12 at 19:17
  • 1
    For a general background, you might be interested in this presentation: http://www.wolfram.com/mathematica/customer-stories/developing-interactive-textbooks-with-cdf.html . It is much more than static images, but they are possible too, and perhaps even easier obtained at the end as "snapshots" of more dynamic ones. – Leonid Shifrin Jan 05 '12 at 19:21
  • 3
    @LeonidShifrin I have noticed that many legitimate Mathematica questions get close-voted. – Tim Jan 05 '12 at 19:23
  • 3
    @Tim Kemp This will hopefully end soon, since we have a new SE Mathematica site proposal getting momentum:http://area51.stackexchange.com/proposals/37304/mathematica . Please consider supporting it. – Leonid Shifrin Jan 05 '12 at 19:30
  • First of all thanks to Szabolcs on a really useful link. I'm a newbie to stackoverflow.com and I really like it. I think I didn't get still how things work here (e.g. I'm unfamiliar to close-voted), but I've seen the proposal and I like it, even I don't understand why it's not functional yet. Anyway thank you. – balboa Jan 05 '12 at 19:40
  • @Szabolcs approach should get you far. `Offset` is your friend, as is the third argument of `Text`, etc... – Brett Champion Jan 05 '12 at 19:42
  • 5
    @LeonidShifrin & Szabolcs After some thought I have committed; it really is too big an environment to live here and many questions are not strictly programming-related. Thank you for making us aware of the proposal. – Tim Jan 05 '12 at 19:43
  • 1
    @Tim Kemp Thanks for supporting the proposal. Having a dedicated SE site for Mathematica should be a really good thing. – Leonid Shifrin Jan 05 '12 at 19:55
  • 2
    @TimKemp I see you've just committed to the proposal, but your account is not linked to the one on [so] (says unregistered). Since you have more than 200 rep here, it counts more towards the commitment than an "unregistered user". I think all you need to do to is to click "register" on your account on [a51] and sign in with the _same_ openid you use for [so]. – abcd Jan 05 '12 at 20:13
  • 1
    @yoda Have done so. Hope it helps. – Tim Jan 05 '12 at 20:18
  • I use Microsoft Visio for making many of my diagrams. Just google `visio stencil` to see examples. When I get better in M, may be I can write code to do them directly there, but for now, Visio would be much easier for me for making diagrams like the one you showed. http://www.microsoft.com/download/en/details.aspx?id=2497 – Nasser Jan 06 '12 at 01:59
  • @balboa, thank you for committing to the [proposal](http://area51.stackexchange.com/proposals/37304/mathematica), but your Stack Overflow account is not linked to the [area51.se] account. Since you are quickly approaching 200 rep, it would be helpful if they were linked. We need 100 experienced users (200+ rep) to commit. – rcollyer Jan 06 '12 at 03:09
  • @rcollyer I did registration, I think it's what I should have done. Glad if I can help. – balboa Jan 06 '12 at 08:11
  • @balboa, yes, you're accounts are now linked. So, thanks. – rcollyer Jan 06 '12 at 19:23
  • I also wished there was a more comprehensive high level "compound primitives" library on Mathematica, but since even the graphics legends are clumsy, it doesn't seem to be a priority. Lets hope the needs for the MathModelica integration bring new capacities of this kind. – P. Fonseca Jan 07 '12 at 10:32
  • before joining to this forum community I posted similar question on Wolfram forum, I have got one also nice answer on making custom plots.. If someone is interested in same topic as I am, you can see the the nice example. Here's the link: http://forums.wolfram.com/student-support/topics/27385 – balboa Jan 09 '12 at 15:30

6 Answers6

19

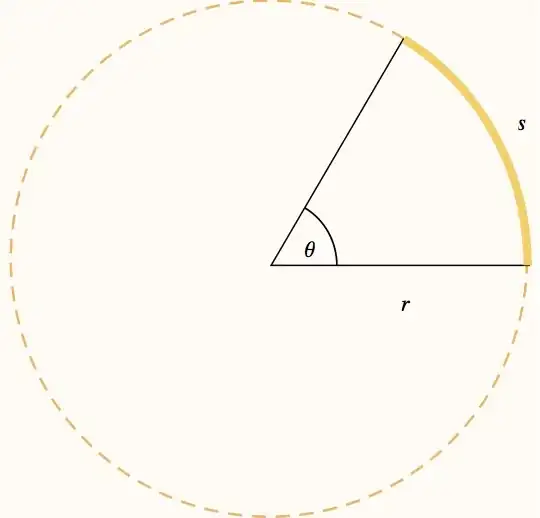
Here is a simple/basic way to do the first one:

Graphics[{

 (* The dashed circle segment *)
 {
  Dashing[{.04, .01}], 
  Darker[Orange], 
  AbsoluteThickness[2], 
  Circle[{0, 0}, 1, {1, 2 \[Pi]}]
 },

 (* The solid circle segment *)
 {
  Orange, 
  AbsoluteThickness[2], 
  Circle[{0, 0}, 1, {0, 1}]
 },

 (* The radial lines and the small circle segment *)
 Line[{{0, 0}, {1, 0}}],
 Line[{{0, 0}, {Cos[1], Sin[1]}}],
 Circle[{0, 0}, .2, {0, 1}],

 (* Various text labels *)
 {
  Text[Style["\[Theta]", 24], .3 {Cos[.5], Sin[.5]}], 
  Text[Style["s", 24], 1.1 {Cos[.5], Sin[.5]}], 
  Text[Style["r", 24], {.5, -.1}]
 }
}]

Mathematica graphics

The following is the exact same thing, but wrapped in Manipulate and parameterized on the angle alpha:

Manipulate[
 Graphics[{
  {Dashing[{.04, .01}], Darker[Orange], AbsoluteThickness[2], 
  Circle[{0, 0}, 1, {\[Alpha], 2 \[Pi]}]},
  {Orange, AbsoluteThickness[2], Circle[{0, 0}, 1, {0, \[Alpha]}]},
  Line[{{0, 0}, {1, 0}}],
  Line[{{0, 0}, {Cos[\[Alpha]], Sin[\[Alpha]]}}],
  Circle[{0, 0}, .2, {0, \[Alpha]}],
  {Text[Style["\[Theta]", 
  24], .3 {Cos[\[Alpha]/2], Sin[\[Alpha]/2]}], 
  Text[Style["s", 24], 1.1 {Cos[\[Alpha]/2], Sin[\[Alpha]/2]}], 
  Text[Style["r", 24], {.5, -.1}]}
 }],
{{\[Alpha], 1}, 0, 2 \[Pi]}]

If you move the slider, the content will change accordingly:

Mathematica graphics

Arnoud Buzing
  • 15,383
  • 3
  • 20
  • 50
  • 1
    love it. thank you very much, just one question: How to learn to draw graphics like this? If you could give reference to tutorials, I mean how have you learned it? Thank you! – balboa Jan 05 '12 at 22:29
  • 1
    If you are going to create lots of these sorts of graphics, I would recommend reading the help page on Graphics (http://reference.wolfram.com/mathematica/ref/Graphics.html?q=Graphics&lang=en) and also the pages on Directives (http://reference.wolfram.com/mathematica/guide/GraphicsDirectives.html), which modify the graphics primitives. – Arnoud Buzing Jan 05 '12 at 22:45
  • 2
    Did you extend the image uploader palette to support animations? I wanted to do this but didn't have time yet! If you did this, could you mail it by any chance? :-) – Szabolcs Jan 06 '12 at 08:49
  • @Szabolcs - No, I did not make any changes/additions to your (very useful) palette. – Arnoud Buzing Jan 06 '12 at 15:23
14

Edit You can get inspiration from the Demonstrations project too. These are the triangle-related demonstrations. After taking a quick look, I think you should see the geometry-related demonstrations by Jay Warendorff. He has made a lot of these, and they use a structured set of geometry-related functions that you most likely can reuse.


Here's an angleArc function to get you started. This is just a small example of a helper function you could use, there's a lot of room for improvement.

angleArc[Polygon[vertices_List, ___], r_, i_] :=
 Module[{a, b, c, phi1, phi2},
  {a, b, c} = Take[RotateLeft[vertices, i-2], 3];
  {phi1, phi2} = Sort@N[{ArcTan @@ (a - b), ArcTan @@ (c - b)}];
  If[phi2 - phi1 > Pi, phi1 += 2 Pi];
  Circle[b, r, {phi2, phi1}]
 ]

poly = Polygon[{{0, 0}, {1, 2}, {2, 1}}];

Graphics[{EdgeForm[Thick], FaceForm[None], poly, 
  Table[angleArc[poly, .2, i], {i, Length[poly[[1]]]}]}]

Mathematica graphics

Manipulate[
 With[{poly = Polygon[{a, b, c}]},
  Graphics[
   {EdgeForm[Thick], FaceForm[None], poly, 
    Table[angleArc[poly, .2, i], {i, Length[poly[[1]]]}]},
   PlotRange -> 2 {{-1, 1}, {-1, 1}}, Frame -> True
   ]
  ],
 {{a, {0, 0}}, Locator}, {{b, {1, 0}}, Locator}, {{c, {0, 1}}, Locator}
 ]

Mathematica graphics

Szabolcs
  • 24,728
  • 9
  • 85
  • 174
  • Thank you, I'm really grateful for these examples. – balboa Jan 05 '12 at 19:59
  • 1
    @balboa Please see the link I just edited into the answer. I would perhaps mail the author of those demonstrations and ask kindly for the latest version of his geometry functions. The demonstration source code on its own is a great resource, if a little overwhelming for a beginner. – Szabolcs Jan 05 '12 at 20:43
  • Thank you, once again. I'll do so. You have really helped. – balboa Jan 05 '12 at 20:52
  • I already gave you +1, but I'd do it again for the Demonstrations link. The Demonstrations Project is a fabulous resource, as deep as it is wide. – Tim Jan 05 '12 at 21:01
  • 1
    @balboa Consider this question http://stackoverflow.com/questions/8462244/controlling-measure-zero-sets-of-solutions-with-manipulate-a-case-study as a kind of inspiration while working on a math book, it is in the same direction as Szabolcs pointed out. – Artes Jan 19 '12 at 14:46
  • 1
    This question would be another hint for your quest: http://stackoverflow.com/questions/8235778/cone-image-refinement – Artes Jan 19 '12 at 14:59
9

One excellent, Wolfram-supported product is Geometrica. It's not a cheap add-on at $495, but it will produce diagrams like yours far easier than doing them in raw MMA Mathematica. It's basically a very large extension of Szabolcs approach in the comments - a library of functions to draw stuff.

Tim
  • 5,024
  • 2
  • 30
  • 58
8

I like Mathematica a lot. But there are better options for geometric drawing.

Here you have a five minutes sketch done with Geometry Expressions (very low resolution used):

enter image description here

Geometry Expressions does some nice planar geometry calculations and can export the results to Mma online.

Dr. belisarius
  • 60,527
  • 15
  • 115
  • 190
  • I just tried this program it's easy to use. It has user friendly environment. Just if you are going to export graphics to EPS - don't, because it does not work. It looks awful, but BMP looks nice. btw do you know how to unhide object, after I hid it? – balboa Jan 06 '12 at 00:30
  • 1
    @balboa To hide/unhide use the "Toggle" under the view menu – Dr. belisarius Jan 06 '12 at 13:40
  • @balboa And no, I never export to eps from GE – Dr. belisarius Jan 06 '12 at 13:42
  • 1
    thanks for sharing this program with us – balboa Jan 06 '12 at 15:53
  • Another alternative I like a lot: Geogebra, http://www.geogebra.org/cms/ (it usually takes just a few seconds to make such plots, they can be annotated and exported very easily too). – Jens Jan 06 '12 at 17:07
5

Yes, Mathematica's built-in graphics tools are a bit quirky in places, and there are some annoying omissions. But there's a good range of basic graphics, and, on the plus side, you're only a few keystrokes away from the mathematical tools you need to rectify some of the deficiencies of the graphics editor. Need an arc? Just calculate it below and copy/paste it in. Can't do that with Adobe Illustrator! There's broad access to equations and greek characters too. It could be helpful when there's nothing else to hand.

Here's the first one - it's not totally unacceptable ... :)

mathematica built-in graphics

cormullion
  • 1,672
  • 1
  • 10
  • 24
  • "Just calculate it below and copy/paste it in"... I guess you forgot to include the code. – abcd Jan 05 '12 at 22:46
  • I didn't get it, in which program you did this(Mathematica?). It looks nice. "Just calculate it below"-- can you be more specific, maybe to post a code of graphic? thanks for answer – balboa Jan 05 '12 at 22:52
  • 3
    This was done in Mathematica, using the drawing tools. Circle, line, set the width of the lines, choose a dashed style, pick a colour, and so on. As for the code, I typed in `Graphics[Circle[{0, 0}, 1, {0, Pi/3}]]` and pasted the arc into the graphic I was working on. – cormullion Jan 05 '12 at 23:12
  • 1
    @cormullion hope you saw the comments on the above question, mentioning the [proposal for a Mathematica-specific StackExchange site](http://area51.stackexchange.com/proposals/37304/mathematica). It would be great to see you commit and be involved in the beta site. – Verbeia Jan 07 '12 at 13:20
5

Presentations is an excellent and low-cost ($50) graphics (and much more) package in MMA, written by David Park. http://home.comcast.net/~djmpark/DrawGraphicsPage.html

It is mentioned as resource n.2 in our stackoverflow tool bag What is in your Mathematica tool bag?

Community
  • 1
  • 1
magma
  • 626
  • 5
  • 15