36

I used to verify that some of my variables had the expected retain count using [myVar retainCount] under the debugger, especially for var that did not have a custom dealloc.

How do you do this in ARC mode? How do you ensure that there are no memory leaks?

Note: I understand that ARC should handle this for me, but life is far from being perfect, and in real life you have objects that are sometimes allocated by third party libraries (using retain?) and never deallocated.

Image that I do this:

MyObj *myObj=[[MyObj alloc] init];

then I call

[somethingElse doSomethingWithMyObj:myObj];

and later, I do

myObj=NULL;

If my program is working fine, my expectation is that myObj is being destroyed, but it appears not to be the case...

So how can I track this, especially if somethingElse is not managed by me?

Now, about the tools: it seems extremely hard to run memory tools on my mac (with 5 Meg) without rebooting the mac and starting from scratch. This is really annoying! Instruments keep crashing even before the program has started, so is there an alterante solution?

enjayem
  • 941
  • 8
  • 21
tomsoft
  • 4,448
  • 5
  • 28
  • 35

7 Answers7

104

You can use CFGetRetainCount with Objective-C objects, even under ARC:

NSLog(@"Retain count is %ld", CFGetRetainCount((__bridge CFTypeRef)myObject));

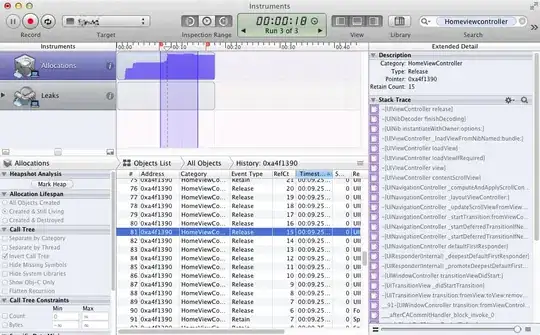
This is not particularly useful for debugging, though, for reasons amply described elsewhere. If you need to understand where an object is being retained and released, check out this answer for help using the Allocations instrument.

The only case I've found where examining the retain count is actually useful is in a dealloc method, when something retains and autoreleases the object being deallocated. This will cause a crash later when the autorelease pool is drained. You can pinpoint the cause of this by checking the retain count before and after each message. In this way I discovered that the observationInfo method (which is itself usually only useful for debugging) retains and autoreleases self. However, even this sort of problem can usually be solved without examining the retain count, simply by wrapping the entire body of dealloc in an @autoreleasepool block.

However, the retain count can be used to learn about the implementation of some classes. (Only do this for entertainment or curiosity! Never rely on undocumented implementation details in production code!)

For example, try this immediately inside the @autoreleasepool in main:

NSNumber *n0 = [[NSNumber alloc] initWithInt:0];
NSLog(@"0 reference count = %ld", CFGetRetainCount((__bridge CFTypeRef)n0));
// Prints 2 in my test

So NSNumber likely caches (or at least reuses) some instances. But not others:

n0 = [[NSNumber alloc] initWithInt:200];
NSLog(@"n0 reference count = %ld", CFGetRetainCount((__bridge CFTypeRef) n0));
// Prints 1 - I am the sole owner of this instance.  There could be weak
// or unretained references to it, but no other strong references.

NSNumber *n1 = [[NSNumber alloc] initWithInt:200];
NSLog(@"n1 reference count = %ld", CFGetRetainCount((__bridge CFTypeRef) n1));
// Prints 1 again.  New instance with same value as prior instance.
// You could of course compare pointers to see that they are separate
// instances.

You can even discover that NSNumber returns a singleton if you alloc but don't initialize:

n1 = [NSNumber alloc];
NSLog(@"n1 reference count = %ld", CFGetRetainCount((__bridge CFTypeRef) n1));
// Prints -1.

(Note that you can also learn many details about NSNumber by looking at the Core Foundation source code, which is available at http://opensource.apple.com. But who knows what you might find if you look at the retain count of objects that aren't toll-free-bridged with objects in Core Foundation?)

Community
  • 1
  • 1
rob mayoff
  • 375,296
  • 67
  • 796
  • 848
  • 3
    This is nice for debugging purposes. – Matt Hudson Apr 09 '12 at 23:32
  • 37
    No, it isn't. It is even more misleading under ARC than it would be otherwise (since the compiler will move retain/release/autorelease calls across optimization levels, releases and, potentially, debugging or not). – bbum May 31 '13 at 00:27
  • 9
    Wow. That is one hell of an edit! +1! Fun detail; your `NSNumber` example with a value of `200` will change behaviors on different platforms and different OS releases because of implementation details (tagged pointers, for example), further underlying how unpredictable `retainCount` can be. – bbum May 31 '13 at 05:39
41

You don't. ARC handles the memory management for you and does not allow you to call retainCount and even if you could see it, the number it returns is meaningless for you. If you want to you should be doing memory profiling in Instruments with the Leaks and Allocations instruments. That is the best way to look and see how your application is allocating memory and catch any improper use of memory there.

Colin Wheeler
  • 3,343
  • 2
  • 21
  • 23
  • 1
    What happens if Instruments keep crashing? – tomsoft Jan 17 '12 at 11:35
  • 5
    Then you need to look and see why Instruments is crashing, idk if your tracing way too much at once, or maybe you need to reinstall the dev tools. If Instruments is consistently crashing all the time it sounds like something I might make another question for or (maybe better) take to the Apple Developer forums. – Colin Wheeler Jan 17 '12 at 16:06
31

You should never use retainCount for anything, with or without ARC.

When to use -retainCount?

Community
  • 1
  • 1
UIAdam
  • 5,303
  • 1
  • 27
  • 23
15

Use Instruments and locate the object you want to track by searching for the class name or pointer address if you have it while in in "Objects List".

When you have located it, hit the disclosure arrow on the instance. This brings you to a history view for retains and relases.

If you expand the right side detail view you will also see the callstack for each retain/release.

Instruments showing object history and callstack detail

Henrik Hartz
  • 3,677
  • 1
  • 27
  • 28
  • 1
    This is very helpful. Stackoverflow and other places have very poor documentation on how to use Instruments to debug retain cycles. This screenshot and short description helped me figure it out – lschult2 Jun 20 '13 at 04:35
  • 1
    Had trouble with this until I found this answer: http://stackoverflow.com/questions/29121260/instruments-allocations-not-showing-app-classes-objects – Saltymule Jul 21 '15 at 17:33
  • @Saltymule why the downvote? that doesn't seem directly related to the answer but is rather a generic issue of how Xcode loads the symbols – Henrik Hartz Jul 27 '15 at 09:31
  • @HenrikHartz I didn't downvote as far as I can tell. The answer I referenced indicates that 8.2 and 8.3 don't load the symbol information properly. I had trouble with this answer until I tried it on an 8.1 simulator. That comment is meant to provide breadcrumbs for future readers who run into the same issue. – Saltymule Jul 27 '15 at 11:06
  • @Saltymule my bad, I stupidly assumed the last comment was a d/v when clicking into the notification :) thanks for adding value to the post! – Henrik Hartz Jul 29 '15 at 09:30
3

I believe the only way is to profile your application using the Allocations instrument. You will need to click on the info descriptor (the 'i' next to Allocation in the left pane) and click on "Record Reference Counts". You can then profile your app and do a search for the specific class you're looking to inspect. From there you can find the retain count in the Extended Detail pane for each instance of the class.

You can also do this using Leaks as well (since I believe it's a variation of the Allocations instrument).

Aaron Hayman
  • 8,492
  • 2
  • 36
  • 63
  • 1
    Almost; you profile your app using the allocations instrument, no need to record reference counts at all. If memory is growing, *then* you can use tools like heapshot analysis and/or recording reference counts to track down the memory accretion. – bbum Jan 14 '12 at 18:15
  • Well, that's if he's looking to check for memory leaks (which is probably true), but he asked how to verify retain counts, and I believe this is the only way. – Aaron Hayman Jan 14 '12 at 18:21
  • 1
    Verifying retain counts is an absolutely useless thing to do, though. Complete waste of time and it is entirely fair to point that out in writing your answer. – bbum Jan 14 '12 at 19:09
  • No, not a complete waste. One object may have more than one retain cycle, and checking the retain count can confirm this (I've actually had that happen, and yes, the retain count showed 2 more than it should have). While this is probably rare, I suspect it is less rare for people who use blocks...especially if they're new at it. – Aaron Hayman Jan 14 '12 at 23:06
  • 3
    You can't assume anything about the retain count. The frameworks can -- and do -- often retain stuff behind your back and sometimes in surprising ways. Looking at the `retainCount` is a waste of time. If you have an accretion of memory, you have to know the backtrace of the retain to have it make any sense. The retain count, in and of itself, is utterly useless for debugging purposes and the `retainCount` method should be removed. – bbum Jan 15 '12 at 00:27
  • not checking the retaincount seems to be a very "idealisitic" position. And I am talking of debugging and tracking memory leaks. I am the only one who have instrument tools useless because of too many crash? So I would be pleased to have your debugging techniques (without Instrument) to ensure that NO memory is leaked.... – tomsoft Jan 17 '12 at 11:42
  • 1
    I actually haven't had a problem with Instruments crashing, so I use it extensively. If it's not "Instruments" that's crashing but your app crashing in Instruments, this may be due to a more subtle bug. Instruments usually uses a release build, while debugging uses the debug build. Using the static analyzer also helps: Product -> Analyze. Other than that, I scour the code to find the leak...but I do rely a lot on instruments. And I do check retain counts when I suspect a retain cycle, primarily to determine if there is more than one cycle. – Aaron Hayman Jan 17 '12 at 13:05
2

Get the object's retainCount?

You can just make a breakpoint and input the command below to get the object's retainCount

po object.retainCount
Manos Nikolaidis
  • 21,608
  • 12
  • 74
  • 82
Jason Yu
  • 311
  • 3
  • 15
0

You don't. Apple say you don't need to as ARC will handle it for you.

Darren
  • 10,182
  • 20
  • 95
  • 162
  • Understand, but what happen with specific qualifier, external non arc libraries, .... – tomsoft Jan 17 '12 at 11:39
  • 1
    You use the compiler flag -fno-objc-arc to not use ARC with them libraries. – Darren Jan 17 '12 at 13:50
  • I know how to compile non ARC lib with ARC code, but my question was how to ensure that there is no memory leak in the complete chain, and that an object have the expected retain count . – tomsoft Jan 17 '12 at 14:18
  • I'm pretty new to obj-c, but i'm pretty sure in the WWDC Introducing ARC talk they say they designed ARC so you really dont hve to worry about retain counts at all. It just works. – Darren Jan 17 '12 at 20:40
  • 1
    “It just works” until you refer to `self` or an instance variable from within a block, thereby causing capturing, thereby often causing a retain cycle. The compiler can warn you about some of these cases, but not all. (And that's not the only potential problem that ARC can't solve. Wrong bridge casts are another. The compiler still cannot read your mind.) Instruments's memory-profiling tools are still needed. – Peter Hosey May 31 '13 at 03:23