I am reading data in from a GIS database and creating a map with mpl_toolkits.basemap and matplotlib. Some of the data creates complex polygons (defined by an exterior and interior rings). However, I haven't been able to track down how to create a polygon with holes. Is this even possible with matplotlib? Is there another method for creating this image?
Asked
Active
Viewed 6,134 times
4 Answers
14
You can actually plot polygons with holes in matplotlib. The trick is to use Path and PathPatch. For example:
import matplotlib.pyplot as plt
from matplotlib.patches import PathPatch
from matplotlib.path import Path

axes = plt.gca()

path = Path([(2,2)      ,(2,-2)     ,(-2,-2)    ,(-2,2)     ,(0,0)         ,(1,0)      ,(-1,1)     ,(-1,-1)    ,(0,0)         ],
            [Path.MOVETO,Path.LINETO,Path.LINETO,Path.LINETO,Path.CLOSEPOLY,Path.MOVETO,Path.LINETO,Path.LINETO,Path.CLOSEPOLY])
patch = PathPatch(path)
axes.set_xlim(-3,3)
axes.set_ylim(-3,3)
axes.add_patch(patch)

plt.savefig('example.png')
plt.close('all')
The above results in
 Note that winding order seems to be important.
-
yay! Thank you for posting, this is very simple. – Jason S Sep 21 '19 at 22:50
2
Coming late, but I patched @Matt's answer with this approach to produce this code code (also in this gist):
import numpy as np
from matplotlib.path import Path
from matplotlib.patches import PathPatch


def patchify(polys):
    """Returns a matplotlib patch representing the polygon with holes.

    polys is an iterable (i.e list) of polygons, each polygon is a numpy array
    of shape (2, N), where N is the number of points in each polygon. The first
    polygon is assumed to be the exterior polygon and the rest are holes. The
    first and last points of each polygon may or may not be the same.

    This is inspired by
    https://sgillies.net/2010/04/06/painting-punctured-polygons-with-matplotlib.html

    Example usage:
    ext = np.array([[-4, 4, 4, -4, -4], [-4, -4, 4, 4, -4]])
    t = -np.linspace(0, 2 * np.pi)
    hole1 = np.array([2 + 0.4 * np.cos(t), 2 + np.sin(t)])
    hole2 = np.array([np.cos(t) * (1 + 0.2 * np.cos(4 * t + 1)),
                      np.sin(t) * (1 + 0.2 * np.cos(4 * t))])
    hole2 = np.array([-2 + np.cos(t) * (1 + 0.2 * np.cos(4 * t)),
                      1 + np.sin(t) * (1 + 0.2 * np.cos(4 * t))])
    hole3 = np.array([np.cos(t) * (1 + 0.5 * np.cos(4 * t)),
                      -2 + np.sin(t)])
    holes = [ext, hole1, hole2, hole3]
    patch = patchify([ext, hole1, hole2, hole3])
    ax = plt.gca()
    ax.add_patch(patch)
    ax.set_xlim([-6, 6])
    ax.set_ylim([-6, 6])
    """

    def reorder(poly, cw=True):
        """Reorders the polygon to run clockwise or counter-clockwise
        according to the value of cw. It calculates whether a polygon is
        cw or ccw by summing (x2-x1)*(y2+y1) for all edges of the polygon,
        see https://stackoverflow.com/a/1165943/898213.
        """
        # Close polygon if not closed
        if not np.allclose(poly[:, 0], poly[:, -1]):
            poly = np.c_[poly, poly[:, 0]]
        direction = ((poly[0] - np.roll(poly[0], 1)) *
                     (poly[1] + np.roll(poly[1], 1))).sum() < 0
        if direction == cw:
            return poly
        else:
            return poly[::-1]

    def ring_coding(n):
        """Returns a list of len(n) of this format:
        [MOVETO, LINETO, LINETO, ..., LINETO, LINETO CLOSEPOLY]
        """
        codes = [Path.LINETO] * n
        codes[0] = Path.MOVETO
        codes[-1] = Path.CLOSEPOLY
        return codes

    ccw = [True] + ([False] * (len(polys) - 1))
    polys = [reorder(poly, c) for poly, c in zip(polys, ccw)]
    codes = np.concatenate([ring_coding(p.shape[1]) for p in polys])
    vertices = np.concatenate(polys, axis=1)
    return PathPatch(Path(vertices.T, codes))
yohai
- 438
- 5
- 15
1
Old question, but ...
Just explicitly close your exterior and interior boundaries and sum them together. Technically, there will be a seam, but you won't see it (IF you provide a color argument--not exactly sure why this is the case).
#!/usr/bin/env python3

import matplotlib.pyplot as plt

# a 4x4 box (counterclockwise)
ext_x = [2, -2, -2, 2, 2]
ext_y = [2, 2, -2, -2, 2]

# a 2x2 hole in the box (clockwise)
int_x = [item/2.0 for item in ext_x][::-1]
int_y = [item/2.0 for item in ext_y][::-1]

# if you don't specify a color, you will see a seam
plt.fill(ext_x+int_x, ext_y+int_y, color='blue')

plt.show()
Shay
- 1,368
- 11
- 17
-
Great! But if you set alpha<1, then the seam is again visible, unless you specify also lw=0. – fra_pero Oct 22 '20 at 09:27
-
What about if I set alpha<1 but I only want the external edges? Maybe I should post a new question. – fra_pero Oct 22 '20 at 09:29
-1
How about fill_between()?
http://matplotlib.sourceforge.net/api/pyplot_api.html#matplotlib.pyplot.fill_between
I'm not sure exactly how to pull off a polygon, but it works like this
import numpy as np
import matplotlib.pylab as plt

x=np.arange(-3,3.5,.5)
y1=-x**2+9
y2=-x**2+10
plt.fill_between(x,y1,y2)

You should be able to build up your figure one fill_between at a time until you have what you want.
Or possibly path. Check out these screenshots and see if anything seems close.
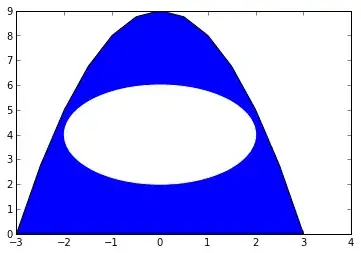
Edit: You might mean a hole like this
import numpy as np
import matplotlib.pylab as plt

x=np.arange(-3,3.5,.5)
y1=-x**2+9
y2=0
plt.fill_between(x,y1,y2)
circ=plt.Circle((0,4),2,color='w')
ax=plt.gca()
ax.add_patch(circ)
plt.show()
Matt
- 954
- 2
- 9
- 21
-
1
-
I don't think I understand "hole in it". I thought you meant hollow. The size of the hole, as I was imagining it, would be determined by where you put y2 in relation to y1. – Matt Jan 19 '12 at 14:08