16

I'm trying to debug and step through an Android application that segfaults. I've tried ndk-gdb, but with little luck. I've also referred to Android NDK Debugging without being able to debug my app.

When I try ndk-gdb --start, and I get:

$ ndk-gdb --start --verbose
Android NDK installation path: /opt/android-ndk-r7
Using default adb command: /opt/android-sdk-linux/platform-tools/adb
ADB version found: Android Debug Bridge version 1.0.29
Using final ADB command: '/opt/android-sdk-linux/platform-tools/adb'
Using auto-detected project path: .
Found package name: com.example.native_plasma
ABIs targetted by application: armeabi armeabi-v7a
Device API Level: 10
Device CPU ABIs: armeabi-v7a armeabi
Compatible device ABI: armeabi-v7a
Found debuggable flag: true
Found device gdbserver: /data/data/com.example.native_plasma/lib/gdbserver
Using gdb setup init: ./libs/armeabi-v7a/gdb.setup
Using toolchain prefix: /opt/android-ndk-r7/toolchains/arm-linux-androideabi-4.4.3/prebuilt/linux-x86/bin/arm-linux-androideabi-
Using app out directory: ./obj/local/armeabi-v7a
Found data directory: '/data/data/com.example.native_plasma'
Found first launchable activity: android.app.NativeActivity
Launching activity: com.example.native_plasma/android.app.NativeActivity
## COMMAND: /opt/android-sdk-linux/platform-tools/adb shell am start -n com.example.native_plasma/android.app.NativeActivity
Starting: Intent { cmp=com.example.native_plasma/android.app.NativeActivity }
## COMMAND: /opt/android-sdk-linux/platform-tools/adb shell sleep 2
Found running PID: 0
ERROR: Could not extract PID of application on device/emulator.
       Weird, this probably means one of these:

         - The installed package does not match your current manifest.
         - The application process was terminated.

       Try using the --verbose option and look at its output for details.

This indicates that the application segfaulted more less, but I don't know how to set a breakpoint here since gdb never actually gives a prompt.

I also tried this command:

$ ../../toolchains/arm-linux-androideabi-4.4.3/prebuilt/linux-x86/bin/arm-linux-androideabi-addr2line -f -e  libs/armeabi/libnative-plasma.so 
bedb2330
??
??:0

I have debug symbols I believe.

  • ndk-build -B V=1 APP_OPTIM=debug
  • Android.mk in jni/ has LOCAL_CFLAGS := -g
  • ant debug

I've also ndk-build NDK_DEBUG=1 but I still get where it looks like I don't have debug symbols.

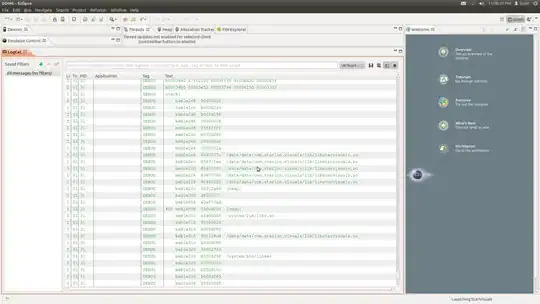
Here's an image of the stack trace. It doesn't get any more informative:

Traceback

Community
  • 1
  • 1
Scott
  • 5,135
  • 12
  • 57
  • 74
  • I don't know if it will help, but if you're looking for some documentation (it's out of date, mind, as it talks about NDK r5b), then I wrote a guide a few months ago that you can find [here](http://www.doc.ic.ac.uk/~cb908/AndroidNDK.html). I'm afraid I can't offer any more insight on the problem, except just to check the package name outputted in that log is the same as in the manifest (but I imagine it is, as it found the data directory and stuff) – epochengine Jan 19 '12 at 23:02
  • Thanks. Looks like you used Eclipse. I'm using command-lines. I'm hoping I don't have to use Eclipse. :\ – Scott Jan 19 '12 at 23:28
  • Ah, yes, I didn't think of that. The principles should be the same - as far as I'm aware Eclipse just shows the gdb output, and gives gdb the correct commands (for example when you click the step button) - so no, you don't need to use it. You could try turning off optimisations in the `LOCAL_CFLAGS` (-O0 I think), but I doubt it will do much. How far into the app is your first breakpoint? – epochengine Jan 19 '12 at 23:55
  • President Evil, I am unable to make a breakpoint because the program exits before I get a gdb prompt. – Scott Jan 20 '12 at 01:55
  • I did finally get Eclipse working, but it's no more informative so far. – Scott Jan 20 '12 at 05:04
  • The only advantage you might have now is to put a breakpoint in Eclipse right at the beginning of your program, and follow it through until you find where it crashes. But the pid of 0 is odd. Is your app entirely native? It could be an issue with the setup, but I don't know much about that... I don't really know what else to suggest, sorry! (As an aside, I'm happy to see my guide still works!) – epochengine Jan 20 '12 at 21:59
  • Re: `LOCAL_CFLAGS := -g`... `-g` is `-g2`. You might try `-g3`, which includes additional information, like symbolic information such as `#defines`. – jww Sep 06 '14 at 13:33

4 Answers4

11

Well NDK_DEBUG=1 and debuggable flag in manifest set to true are required. When you build the app,in your project/libs/armeabi, there should be a gdb.setup file. There is symbol search path there, check whether it is valid. And did you try this:

ndk-gdb --start --verbose --force

And looks like you are getting a null pointer exception.

Adnaan
  • 141
  • 2
  • 4
  • having spent almost half of beautiful sunny san francisco day, i finally came across your answer and voila, my breakpoints are now getting hit with juno after starting gdb as prescribed by you. MANY MANY thanks!! – Viren Oct 22 '12 at 06:06
  • @Adnaan could you please give an example of adding "debuggable" flag to the AndroidManifest ? Thanks – Sixjac Mar 25 '22 at 01:21
7

In latest versions of NDK and Eclipse plug-in you can right click on package and choose Debug as -> Android Native Application

Sam R.
  • 16,027
  • 12
  • 69
  • 122
shul
  • 221
  • 3
  • 10
1

Make sure that you load your native library in either a launchable activity or in your Application class. Otherwise it wouldn't work and you'll get the following error No symbol table is loaded. Use the "file" command..

For example in Application class:

import android.app.Application;

public class MyApp extends Application {

    static {
        System.loadLibrary("Name");
    }

    public static native int doSomething();
}

Name is the name of your library (.so file) without the lib part.

DeathlessHorsie
  • 161
  • 1
  • 1
  • 7
0

I resolved putting --nowait option to the shell command:

ndk-gdb --start --verbose --nowait
Bemipefe
  • 1,397
  • 4
  • 17
  • 30