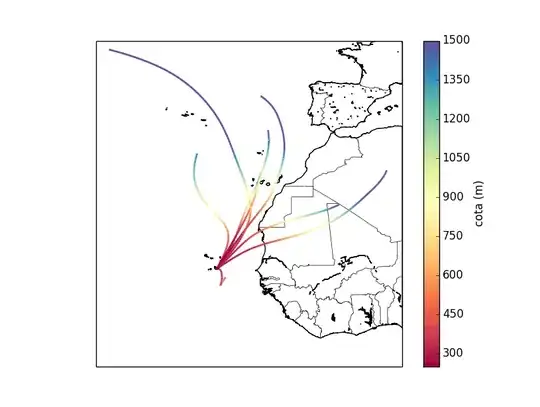
I have an array of y-values that form a line. Additionally, I have an array with the same number of elements as the y-array of values ranging from 0 to 1. We'll call this array 'z'. I want to plot the array of y-values so that the color of each point corresponds with the z-value.
In gnuplot, you can do this using the 'lc variable':
plot ’data’ using 1:2:3 with points lc variable
Using the advice from here: Matplotlib scatterplot; colour as a function of a third variable
, I was able to use a scatter plot, which did work:
import matplotlib as mpl
import matplotlib.pyplot as plt

plt.scatter(x, y, c=z, s=1, edgecolors='none', cmap=mpl.cm.jet)
plt.colorbar()
plt.show()
Is there a way to do this with the plot method in matplotlib, similar to this?
plt.plot(x, y, c=z)
When I tried the above code, all of the lines just appeared black.

