7

Just trying to fix this overlapped labeling:
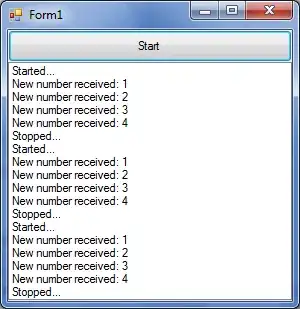
My code:

  values=c(164241,179670)
  labels=c("Private", "Public")
  colors=c("#cccccc", "#aaaaaa")
  categoriesName="Access"
  percent_str <- paste(round(graph$values / sum(graph$values) * 100,1), "%", sep="")

  values <- data.frame(val = graph$values, Type = graph$labels, percent=percent_str )

  pie <- ggplot(values, aes(x = "", y = val, fill = Type)) + geom_bar(width = 1) + 
          geom_text(aes(y = **val + 1**, **hjust=0.5**, **vjust=-0.5**, label = percent), colour="#333333", face="bold", size=10) +
          coord_polar(theta = "y") + ylab(NULL) + xlab(NULL) +
          scale_fill_manual(values = graph$colors) + labs(fill = graph$categoriesName) +
          opts( title = graph$title, 
                axis.text.x = NULL,
                plot.margin = unit(c(0,0,0,0), "lines"), 
                plot.title = theme_text(face="bold", size=14), 
                panel.background = theme_rect(fill = "white", colour = NA) )
  print(pie)

Tried messing with the values marked with asterisks (** **) but haven't got anywhere. Any help appreciated.

fabiopedrosa
  • 2,521
  • 7
  • 29
  • 42

1 Answers1

15

here is an example:

pie <- ggplot(values, aes(x = "", y = val, fill = Type)) + 
  geom_bar(width = 1) + 
  geom_text(aes(y = val/2 + c(0, cumsum(val)[-length(val)]), label = percent), size=10)
pie + coord_polar(theta = "y")

enter image description here

Perhaps this will help you understand how it work:

pie + coord_polar(theta = "y") + 
  geom_text(aes(y = seq(1, sum(values$val), length = 10), label = letters[1:10]))

enter image description here

kohske
  • 65,572
  • 8
  • 165
  • 155
  • do you know how to place them more on the outside? increase the text radius. – fabiopedrosa Jan 21 '12 at 11:22
  • try `geom_text(aes(x = 1.3, y = ...` – kohske Jan 21 '12 at 11:23
  • I really thought I understood your logic until I tried a more complex example :D this is the result: http://i.imgur.com/E5rsC.png for this values: c(81805,78424,19441), labels c("Singapore", "Unknown", "Other") and y = val/2 + c(0, cumsum(val)[-length(val)]) because it made sense. any pointers? – fabiopedrosa Jan 21 '12 at 11:44
  • ah, it should be like this: `y = sum(val)-(val/2 + c(0, cumsum(val)[-length(val)]))` – kohske Jan 21 '12 at 11:59
  • yes, that was it. thanks! just a minor question to finish... is there any way to apply map the label size to the value? I need smaller text in a small pie. – fabiopedrosa Jan 21 '12 at 12:44
  • Actually, I'm not sure if it worked or not. We can see that the size is probably proportional. I tried using a formula like 5+percent*5 for the size, to no luck. Also the grouping on the right, shouldn't happen. – fabiopedrosa Jan 21 '12 at 13:38