I am launching many threads simultaneously, each one writing / reading data into/from a queue; Data is dequeued progressively while it is processed and stored to DB. For some reason the memory is not freed although the Queues are empty and I made sure all event subscription between the data reader and the data processor are unsubscribed at the end of the threads.The amount of squatted RAM is Exactly the amount of the data that is read by binary readers and put into queues.
In order to isolate the problem, I have bypassed the Processing and the DB Storing step.
Why would be the RAM still squatted long after all threads are finished, until I explicitly call GC.Collect() or terminate the program? I manually nullified the Queue after it is emptied, and also nullified the Binary Reader that read the data. I thought that would be enough for the GC to wake up and do its housekeeping at least after a few minutes.

EDIT :
The (reformulated after deletion) QUESTION :
In short, I was always told that the default GC behaviour managed the memory properly and that I shall almost never call the GC explicitly and let the framework do the job.
I would like to know why in this case memory usage drops down only when an explicit Call is made to GC.Collect
EDIT :
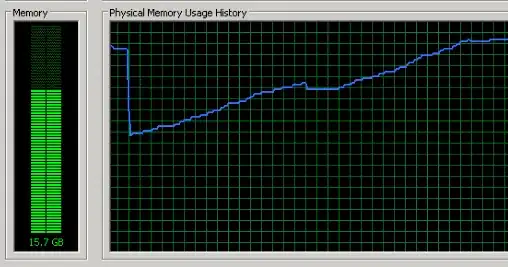
Without GC Collect
With GC Collect (Called on a regular basis)