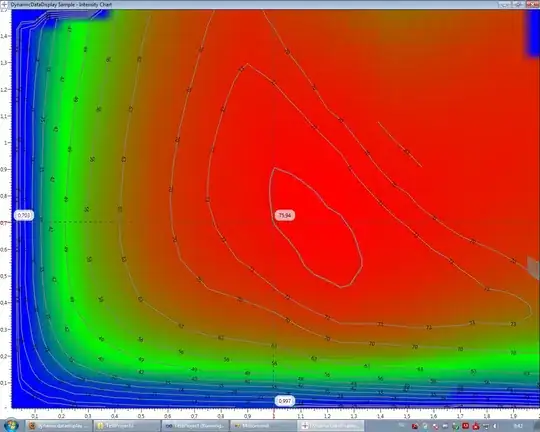
I've got a graph that looks like this:
And I want it to look like this:

I've been using Dynamic Data Display's Isoline library for this.
The issue is that in the upper-right corner, the area is colored, even though all values in that area are 0 (hence why the isolines stop). Does anyone know if there is a way I can adapt my .xaml file so that area will just display a white background color?
Thank you in advance,
CX
My current .xaml file looks like this:
<Window x:Class="IntensityChart.Window1"
    xmlns="http://schemas.microsoft.com/winfx/2006/xaml/presentation"
    xmlns:x="http://schemas.microsoft.com/winfx/2006/xaml"
    xmlns:d3="http://research.microsoft.com/DynamicDataDisplay/1.0"
    Title="DynamicDataDisplay Sample - Intensity Chart" WindowState="Maximized"
    Icon="{x:Static d3:D3IconHelper.DynamicDataDisplayWhiteIcon}">
<Grid>
    <Grid.ColumnDefinitions>
        <ColumnDefinition Width="Auto"/>
        <ColumnDefinition Width="*"/>
    </Grid.ColumnDefinitions>
    <Grid.RowDefinitions>
        <RowDefinition Height="*"/>
        <RowDefinition Height="Auto"/>
    </Grid.RowDefinitions>

    <d3:ChartPlotter Name="plotter" Grid.Row="0" Grid.Column="1">
        <d3:ViewportHostPanel>
            <Image Name="image" d3:ViewportPanel.ViewportBounds="0,0,2,1.5" Stretch="Fill"/>
        </d3:ViewportHostPanel>

        <d3:IsolineGraph Name="isolineGraph"/>
        <d3:IsolineTrackingGraph Name="trackingGraph"/>
        <d3:CursorCoordinateGraph/>

        <d3:CursorCoordinateGraph/>
        <d3:AxisCursorGraph/>
    </d3:ChartPlotter>

</Grid>