Instruments gives me a beautiful breakdown of the reference counting events for my objects like so:
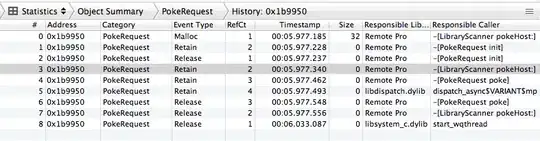
It also tells me inside which method/function the calls occurred. Is there any way to find out which lines are responsible for the calls?
Instruments gives me a beautiful breakdown of the reference counting events for my objects like so:
It also tells me inside which method/function the calls occurred. Is there any way to find out which lines are responsible for the calls?
Have you run both "Leaks" and "Allocations" Instruments separately? ARC generally means you only need to watch the "ownership" of the references. Also, have you spun open the right hand "detail" view in Instruments? That usually gives you the stack of calls for a selected row in the allocation chain.