How to set time interval for Domain axis in TimeSeriesChart? Now i have domain axis with labels which looks something like: 22.00 23.00, 00.00, 1.00, 2.00, etc.
How can I set them like: 11 feb, 12 feb etc. I should have posibility to see all hourse only if I zoom chart.
Edit: Now I solve it with the help of SimpleDateFormat.
DateAxis dateAxis = (DateAxis) plot.getDomainAxis();
DateFormatSymbols dfs = DateFormatSymbols.getInstance(); // default locale
dateAxis.setDateFormatOverride(new SimpleDateFormat("dd-MMM-HH:mm", dfs));
Chart displayed :

Edit: The question is still open: Is it possible to set something like grouping by day for domain axis?
Edit: More information:)
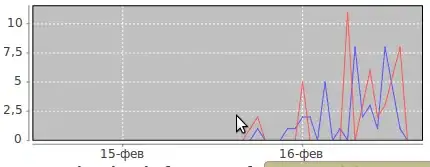
I try to get some data for last week period, but if data in database only for 1 or 2 days, chart will look like this:
as you can see timline on domain axis store information from 00.00(actualy start time is 23.xx) till 10.00, and it's no good, because user should see day which data belongs. In this case I create TimeSeries and fill it like :
TimeSeries ts=new TimeSeries(name);
ts.addOrUpdate(new Hour(date), value);
If I fill ts like
ts.addOrUpdate(new Day(date), value);
then chart didn't show any data

Quistion is how to make chart group data (maybe with the help of zoom ) by days, like in the following chart?