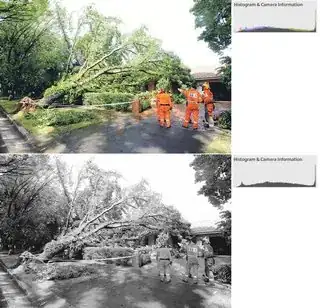
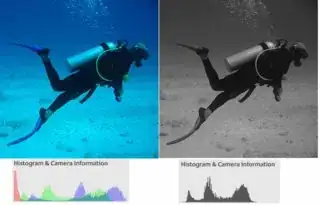
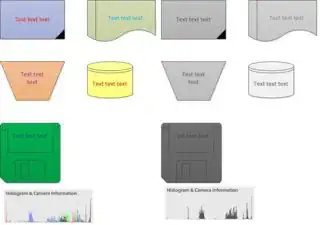
Rather simple, but effective approaches to differentiate between drawings and photos. Use them in combination to achieve a the best accuracy:
1) Mime type or file extension
PNGs are typically clip arts or drawings, while JPEGs are mostly photos.
2) Transparency
If the image has an alpha channel, it's most likely a drawing. In case an alpha channel exists, you can additionally iterate over all pixels to check if transparency is indeed used. Here a Python example code:
from PIL import Image
img = Image.open('test.png')
transparency = False
if img.mode in ('RGBA', 'RGBa', 'LA') or (img.mode == 'P' and 'transparency' in img.info):
    if img.mode != 'RGBA': img = img.convert('RGBA')
    transparency = any(px for px in img.getdata() if px[3] < 220)

print 'Transparency:', transparency
3) Color distribution
Clip arts often have regions with identical colors. If a few color make up a significant part of the image, it's rather a drawing than a photo. This code outputs the percentage of the image area that is made from the ten most used colors (Python example):
from PIL import Image
img = Image.open('test.jpg')
img.thumbnail((200, 200), Image.ANTIALIAS)
w, h = img.size
print sum(x[0] for x in sorted(img.convert('RGB').getcolors(w*h), key=lambda x: x[0], reverse=True)[:10])/float((w*h))
You need to adapt and optimize those values. Is ten colors enough for your data? What percentage is working best for you. Find it out by testing a larger number of sample images. 30% or more is typically a clip art. Not for sky photos or the likes, though. Therefore, we need another method - the next one.
4) Sharp edge detection via FFT
Sharp edges result in high frequencies in a Fourier spectrum. And typically such features are more often found in drawings (another Python snippet):
from PIL import Image
import numpy as np
img = Image.open('test.jpg').convert('L')
values = abs(numpy.fft.fft2(numpy.asarray(img.convert('L')))).flatten().tolist()
high_values = [x for x in values if x > 10000]
high_values_ratio = 100*(float(len(high_values))/len(values))
print high_values_ratio
This code gives you the number of frequencies that are above one million per area. Again: optimize such numbers according to your sample images.
Combine and optimize these methods for your image set. Let me know if you can improve this - or just edit this answer, please. I'd like to improve it myself :-)


