Monitoring my .NET app in Performance Monitor I can see the .NET CLR LocksAndThreads / # of current logical Threads is increasing steadily (currently 293) over time which indicates the thread stack is leaking.
I can find many articles which tell me this is the problem but nothing that tells me how to find the cause - so where do I start? Can Windbg tell me where the problem lies?
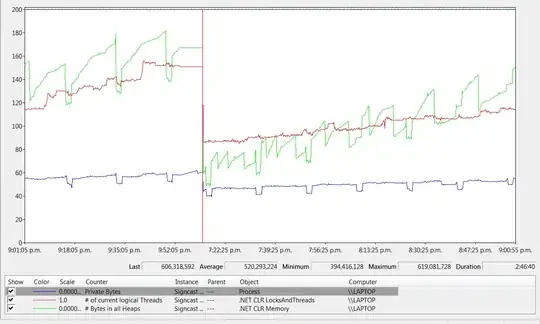
This is my performance monitor over 3hrs telling my current logical threads is 150:
And this is the output of the threads window, which doesn't tell me much because I can't access their call stacks - they are mostly marked as [unavailable] or [In a sleep, wait or join] | [External Code]:
Unflagged       141024  124 Worker Thread   <No Name>       Normal
Unflagged   >   0   0   Unknown Thread  [Thread Destroyed]
Unflagged       136272  2   Worker Thread   <No Name>       Highest
Unflagged       133060  7   Worker Thread   vshost.RunParkingWindow [Managed to Native Transition]  Normal
Unflagged       136952  10  Main Thread Main Thread [edited].Program.Main   Normal
Unflagged       134544  9   Worker Thread   .NET SystemEvents   [Managed to Native Transition]  Normal
Unflagged       136556  11  Worker Thread   Worker Thread   [edited].MessageService.ProcessJobs.AnonymousMethod__0  Normal
Unflagged       141364  113 Worker Thread   <No Name>   [In a sleep, wait, or join] Normal
Unflagged       140896  0   Worker Thread   [Thread Destroyed]      Normal
Unflagged       136776  19  Worker Thread   <No Name>   [In a sleep, wait, or join] Normal
Unflagged       135704  20  Worker Thread   <No Name>   [In a sleep, wait, or join] Normal
Unflagged       136712  21  Worker Thread   <No Name>   [In a sleep, wait, or join] Normal
Unflagged       134984  22  Worker Thread   <No Name>   [In a sleep, wait, or join] Normal
Unflagged       134660  23  Worker Thread   Worker Thread   [edited].BroadcastService.ProcessJobs.AnonymousMethod__1d   Normal
Unflagged       140224  152 Worker Thread   <No Name>       Normal
Unflagged       140792  157 Worker Thread   <No Name>       Normal
Unflagged       137116  0   Worker Thread   <No Name>       Normal
Unflagged       140776  111 Worker Thread   <No Name>       Normal
Unflagged       140784  0   Worker Thread   [Thread Destroyed]      Normal
Unflagged       140068  145 Worker Thread   <No Name>       Normal
Unflagged       139000  150 Worker Thread   <No Name>       Normal
Unflagged       140828  52  Worker Thread   <No Name>       Normal
Unflagged       137752  146 Worker Thread   <No Name>       Normal
Unflagged       140868  151 Worker Thread   <No Name>       Normal
Unflagged       141324  139 Worker Thread   <No Name>       Normal
Unflagged       140168  154 Worker Thread   <No Name>       Normal
Unflagged       141848  0   Worker Thread   [Thread Destroyed]      Normal
Unflagged       135544  153 Worker Thread   <No Name>       Normal
Unflagged       142260  140 Worker Thread   <No Name>       Normal
Unflagged       141528  142 Worker Thread   <No Name>   [In a sleep, wait, or join] Normal
Unflagged       141344  0   Worker Thread   [Thread Destroyed]      Normal
Unflagged       140096  136 Worker Thread   <No Name>       Normal
Unflagged       141712  134 Worker Thread   <No Name>       Normal
Unflagged       141688  147 Worker Thread   <No Name>       Normal
Update: I've since tracked the culprit down to a System.Timers.Timer. Even when this timer called an empty method on each Elapsed event it still raised the logical thread count indefinitely. Just changing the timer to a DispatcherTimer has fixed the problem.
I started looking into all the timers in my application after seeing a large number when running !dumpheap -type TimerCallback in Windbg as mentioned in this question.
I'd still like to know how I could've detected this via Windbg debugging rather than the disable timers/check performance/repeat method that lead me to the fix. I.e. anything that could've told me which timer was creating the problem.