30

I have a disordered list named d that looks like:

[0.0000, 123.9877,0.0000,9870.9876, ...]

I just simply want to plot a cdf graph based on this list by using Matplotlib in Python. But don't know if there's any function I can use

d = []
d_sorted = []
for line in fd.readlines():
    (addr, videoid, userag, usertp, timeinterval) = line.split()
    d.append(float(timeinterval))

d_sorted = sorted(d)

class discrete_cdf:
    def __init__(data):
        self._data = data # must be sorted
        self._data_len = float(len(data))

    def __call__(point):
        return (len(self._data[:bisect_left(self._data, point)]) / 
               self._data_len)

cdf = discrete_cdf(d_sorted)
xvalues = range(0, max(d_sorted))
yvalues = [cdf(point) for point in xvalues]
plt.plot(xvalues, yvalues)

Now I am using this code, but the error message is :

Traceback (most recent call last):
File "hitratioparea_0117.py", line 43, in <module>
cdf = discrete_cdf(d_sorted)
TypeError: __init__() takes exactly 1 argument (2 given)
Hooked
  • 84,485
  • 43
  • 192
  • 261
manxing
  • 3,165
  • 12
  • 45
  • 56
  • 2
    Like the one [shown here](http://matplotlib.sourceforge.net/examples/pylab_examples/histogram_demo_extended.html) (3rd figure)? – chl Feb 21 '12 at 14:01
  • @chl yes, something like that – manxing Feb 21 '12 at 14:05
  • 1
    Your error `__init__() takes exactly 1 argument (2 given)` comes from the fact that your class method `__init__` should take in itself `def __init__(self, data)`. – Hooked Feb 21 '12 at 14:45
  • possible duplicate of [How to plot empirical cdf in matplotlib in Python?](http://stackoverflow.com/questions/3209362/how-to-plot-empirical-cdf-in-matplotlib-in-python) – Dave Feb 04 '15 at 15:32

7 Answers7

43

I know I'm late to the party. But, there is a simpler way if you just want the cdf for your plot and not for future calculations:

plt.hist(put_data_here, normed=True, cumulative=True, label='CDF',
         histtype='step', alpha=0.8, color='k')

As an example,

plt.hist(dataset, bins=bins, normed=True, cumulative=True, label='CDF DATA', 
         histtype='step', alpha=0.55, color='purple')
# bins and (lognormal / normal) datasets are pre-defined

EDIT: This example from the matplotlib docs may be more helpful.

Tomas G.
  • 3,784
  • 25
  • 28
40

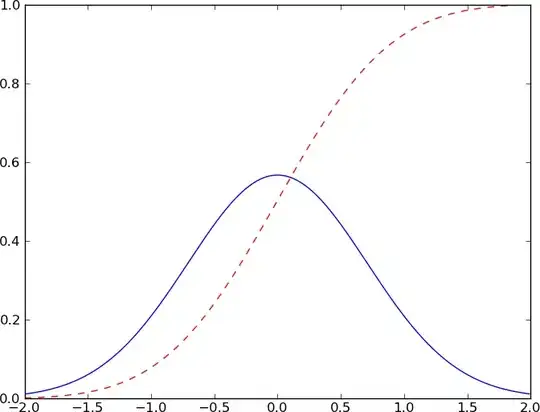
As mentioned, cumsum from numpy works well. Make sure that your data is a proper PDF (ie. sums to one), otherwise the CDF won't end at unity as it should. Here is a minimal working example:

import numpy as np
from pylab import *

# Create some test data
dx = 0.01
X  = np.arange(-2, 2, dx)
Y  = np.exp(-X ** 2)

# Normalize the data to a proper PDF
Y /= (dx * Y).sum()

# Compute the CDF
CY = np.cumsum(Y * dx)

# Plot both
plot(X, Y)
plot(X, CY, 'r--')

show()

enter image description here

Alex K
  • 8,269
  • 9
  • 39
  • 57
Hooked
  • 84,485
  • 43
  • 192
  • 261
  • Since we are normalizing Y (with Y /= (dx*Y).sum() ) to make a PDF, shouldn't the Y.sum() also be equal to 1 instead of 100? – fixxxer Mar 28 '13 at 10:03
  • @fixxxer `Y.sum()` post normalization should not be one, because that total would change if we changed our step size. What should be one is the integral over the domain, i.e. $\int_{-2}^{2} f(x) dx = 1$. _Technically_ the normalization should be `Y /= np.trapz(Y,X)` but since we are using equally spaced steps they are essentially the same thing. – Hooked Mar 28 '13 at 13:54
  • 3
    I only have `Y` as array of measurements. How do I determine my `X`? Do I still set `dx=0.01`? – stefanbschneider Jan 11 '19 at 14:08
9

The numpy function to compute cumulative sums cumsum can be useful here

In [1]: from numpy import cumsum
In [2]: cumsum([.2, .2, .2, .2, .2])
Out[2]: array([ 0.2,  0.4,  0.6,  0.8,  1. ])
MRocklin
  • 55,641
  • 23
  • 163
  • 235
8

Nowadays, you can just use seaborn's kdeplot function with cumulative as True to generate a CDF.

import numpy as np
from matplotlib import pyplot as plt
import seaborn as sns

X1 = np.arange(100)
X2 = (X1 ** 2) / 100
sns.kdeplot(data = X1, cumulative = True, label = "X1")
sns.kdeplot(data = X2, cumulative = True, label = "X2")
plt.legend()
plt.show()

enter image description here

Mayur Kr. Garg
  • 266
  • 2
  • 4
  • 4
    Note that this plots a smoothed *estimate* of the CDF, not the steps for the actual data values. You can see that in the fact that the plotted x values extend below 0, even though the minimum data value is 0. But this pointed me to Seaborn for a way to do it directly: sns.ecdfplot(), which plots the actual stepped values. https://seaborn.pydata.org/generated/seaborn.ecdfplot.html – ELNJ Jun 29 '22 at 19:06
5

For an arbitrary collection of values, x:

def cdf(x, plot=True, *args, **kwargs):
    x, y = sorted(x), np.arange(len(x)) / len(x)
    return plt.plot(x, y, *args, **kwargs) if plot else (x, y)

((If you're new to python, the *args, and **kwargs allow you to pass arguments and named arguments without declaring and managing them explicitly))

Alon
  • 51
  • 1
  • 2
0

What works best for me is quantile function of pandas.

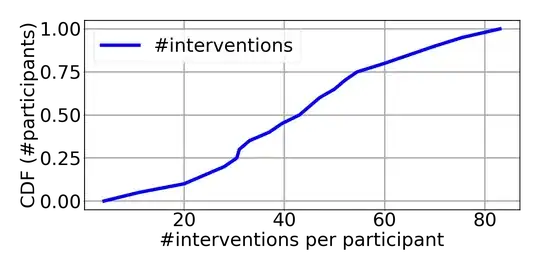
Say I have 71 participants. Each participant have a certain number of interruptions. I want to compute the CDF plot of #interruptions for participants. Goal is to be able to tell how many percent of participants have at least 30 interventions.

step=0.05
indices = np.arange(0,1+step,step)
num_interruptions_per_participant = [32,70,52,52,39,20,37,31,60,57,31,71,24,23,38,4,77,37,79,43,63,43,75,13
,45,31,57,28,61,29,30,52,65,11,76,37,65,28,33,73,65,43,50,33,45,40,50,44
,33,49,24,69,55,47,22,45,54,11,30,13,32,52,31,50,10,46,10,25,47,51,83]

CDF = pd.DataFrame({'dummy':num_interruptions_per_participant})['dummy'].quantile(indices)


plt.plot(CDF,indices,linewidth=9, label='#interventions', color='blue')

enter image description here

According to Graph Almost 25% of the participants have less than 30 interventions.

You can use this statistic for your further analysis. For instance, In my case I need at least 30 intervention for each participant in order to meet minimum sample requirement needed for leave-one-subject out evaluation. CDF tells me that I have problem with 25% of the participants.

Jumabek Alikhanov
  • 2,305
  • 3
  • 21
  • 21
-4
import matplotlib.pyplot as plt
X=sorted(data)
Y=[]
l=len(X)
Y.append(float(1)/l)
for i in range(2,l+1):
    Y.append(float(1)/l+Y[i-2])
plt.plot(X,Y,color=c,marker='o',label='xyz')

I guess this would do,for the procedure refer http://www.youtube.com/watch?v=vcoCVVs0fRI

  • 1.] The code, as is, does not even work (what is `c`?). 2.] More importantly, this is NOT the CDF, just the data added to itself. Try it with some sample data to see the difference. – Hooked Aug 28 '13 at 13:40