I have multiple sets of points (for different years ~20)
I want to generate thiessen polygons for each set of points using r spatial packages.
I know this can be done using GIS but as i want a batch process something in R would be
helpful.
I have multiple sets of points (for different years ~20)
I want to generate thiessen polygons for each set of points using r spatial packages.
I know this can be done using GIS but as i want a batch process something in R would be
helpful.
You haven't given us access to your data, but here's an example for points representing cities of the world, using an approach described by Carson Farmer on his blog. Hopefully it'll get you started...
# Carson's Voronoi polygons function
voronoipolygons <- function(x) {
  require(deldir)
  require(sp)
  if (.hasSlot(x, 'coords')) {
    crds <- x@coords
  } else crds <- x
  z <- deldir(crds[,1], crds[,2])
  w <- tile.list(z)
  polys <- vector(mode='list', length=length(w))
  for (i in seq(along=polys)) {
    pcrds <- cbind(w[[i]]$x, w[[i]]$y)
    pcrds <- rbind(pcrds, pcrds[1,])
    polys[[i]] <- Polygons(list(Polygon(pcrds)), ID=as.character(i))
  }
  SP <- SpatialPolygons(polys)
  voronoi <- SpatialPolygonsDataFrame(SP, data=data.frame(x=crds[,1],
    y=crds[,2], row.names=sapply(slot(SP, 'polygons'),
    function(x) slot(x, 'ID'))))
}
Example 1: Input is a SpatialPointsDataFrame:
# Read in a point shapefile to be converted to a Voronoi diagram
library(rgdal)
dsn <- system.file("vectors", package = "rgdal")[1]
cities <- readOGR(dsn=dsn, layer="cities")

v <- voronoipolygons(cities)

plot(v)

Example 2: Input is vectors of x, y coordinates:
dat <- data.frame(x=runif(100), y=runif(100))
v2 <- voronoipolygons(dat)
plot(v2)
Same principle as shown by jbaums, but simpler code:
library(dismo)
library(rgdal)
cities <- shapefile(file.path(system.file("vectors", package = "rgdal")[1], "cities"))

v <- voronoi(cities)
plot(v)
Note that Voronoi cells are also known as Thiessen polygons.
Alternatively, one can make use of the Simple Features for R, specifically, the sf::st_voronoi() function. Below are examples inspired from this help page:
library(sf)
#> Linking to GEOS 3.8.0, GDAL 3.0.4, PROJ 6.3.1
# generate some random points
set.seed(2020-05-27)
n <- 50
points <- runif(n) %>%
matrix(ncol = 2) %>%
st_multipoint()
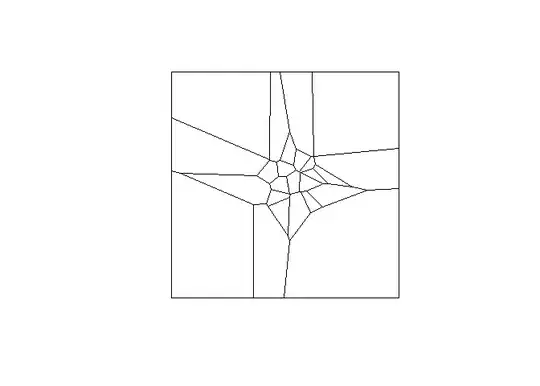
# Voronoi tesselation
voronoi_grid <- st_voronoi(points)
plot(voronoi_grid, col = NA)
plot(points, add = TRUE, col = "blue", pch = 16)

Created on 2020-05-27 by the reprex package (v0.3.0)
Since you mentioned that you have multiple sets of points, one set for a year, you can make use of lists and iterate over them, for example:
library(sf)
#> Linking to GEOS 3.8.0, GDAL 3.0.4, PROJ 6.3.1

# generate a list of length 20, each element containing with random points
set.seed(2020-05-27)
yrs <- 20
n <- 50
points_lst <- vector(mode = "list", length = yrs)
for (i in 1:yrs) {
  points_lst[[i]] <- runif(n) %>%
    matrix(ncol = 2) %>%
    st_multipoint()
}

# Voronoi tesselation for each element of the list
voronoi_grids_lst <- lapply(points_lst, st_voronoi)

# plot 1st element
plot(voronoi_grids_lst[[1]], col = NA)
Created on 2020-05-27 by the reprex package (v0.3.0)