28

How do I write a JavaScript program to display a waveform from an audio file? I want to use Web Audio and Canvas.

I tried this code:

(new window.AudioContext).decodeAudioData(audioFile, function (data) {
   var channel = data.getChannelData(0);
   for (var i = 0; i < channel; i++) {
       canvas.getContext('2d').fillRect(i, 1, 40 - channel[i], 40);
   }
});

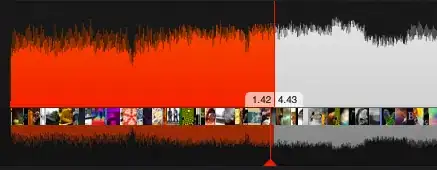
But the result is far from what I want (namely, the image is not smooth since I'm drawing with rectangles). I want it to look smooth like this image:

Waveform example

Any hints on how to implement the waveform?

JAL
  • 41,701
  • 23
  • 172
  • 300
katspaugh
  • 17,449
  • 11
  • 66
  • 103

5 Answers5

46

Rolled out my own library after all: wavesurfer.js.

It draws a waveform from PCM data and seeks regions of the audio by clicking on it.

Imgur

katspaugh
  • 17,449
  • 11
  • 66
  • 103
  • How can I plot the waveform of local audio files (which are not hosted on the sever but are available in some other directory of my PC). Is it possible with your js ? – madLokesh Jan 23 '14 at 06:34
  • @madLokesh, yes, it is possible to plot files using the File API (http://dev.w3.org/2006/webapi/FileAPI/). – katspaugh Jan 23 '14 at 08:57
  • I am using Cordova so I guess I must use the File API of Cordova to access the file but how should I pass the audio file as. As a base64 encoded URl or as an Array Buffer – madLokesh Jan 23 '14 at 09:01
  • 1
    thanks a ton . I would try it out and let you know. I suggest you document the same on your GitHub as well – madLokesh Jan 23 '14 at 09:16
  • For some weird reason I cant get the demo to load the file for the audio when the page loads, but when its dragged and dropped in as a blob it works – Edmund Rojas Aug 16 '14 at 05:35
9

You may be interested in AudioJedit. This is an open source project hosted at GitHub. It have small server-side node.js script for loading audio files, but all interaction with audio implemented in client-side JavaScript. I think this is similar to what you are looking for.

Vadim Baryshev
  • 25,689
  • 4
  • 56
  • 48
  • Vadim, it's almost what I wanted. They don't generate waveform graphics (it's loaded from SoundCloud), but it's easy to add with [`RealtimeAnalyserNode`](https://dvcs.w3.org/hg/audio/raw-file/tip/webaudio/specification.html#dfn-getByteTimeDomainData). Thanks a lot! – katspaugh Mar 06 '12 at 17:27
3

Your render code is extremely inefficient because it will render 44100 pixels for each second of audio. You want to preferably render at most the viewport width with a reduced data set.

The per pixel sample range needed to fit the waveform in the viewport can be calculated with audioDurationSeconds * samplerate / viewPortWidthPx. So for a viewport of 1000px and an audio file of 2 second at 44100 samplerate the samples per pixel = (2 * 44100) / 1000 = ~88. For each pixel on screen you take the min and max value from that sample range, you use this data to draw the waveform.

Here is an example algorithm that does this but allows you to give the samples per pixel as argument as well as a scroll position to allow for virtual scroll and zooming. It includes a resolution parameter you can tweak for performance, this indicates how many samples it should take per pixel sample range: Drawing zoomable audio waveform timeline in Javascript

The draw method there is similar to yours, in order to smooth it you need to use lineTo instead of fillRect.This difference shouldn't actually be that huge, I think you might be forgetting to set the width and height attributes on the canvas. Setting this in css causes for blurry drawing, you need to set the attributes.

let drawWaveform = function(canvas, drawData, width, height) {
   let ctx = canvas.getContext('2d');
   let drawHeight = height / 2;

   // clear canvas incase there is already something drawn
   ctx.clearRect(0, 0, width, height);

   ctx.beginPath();
   ctx.moveTo(0, drawHeight);
   for(let i = 0; i < width; i++) {
      // transform data points to pixel height and move to centre
      let minPixel = drawData[i][0] * drawHeigth + drawHeight;
      ctx.lineTo(i, minPixel);
   }
   ctx.lineTo(width, drawHeight);
   ctx.moveTo(0, drawHeight);
   for(let i = 0; i < width; i++) {
      // transform data points to pixel height and move to centre
      let maxPixel = drawData[i][1] * drawHeigth + drawHeight;
      ctx.lineTo(i, maxPixel);
   }
   ctx.lineTo(width, drawHeight);
   ctx.closePath();
   ctx.fill(); // can do ctx.stroke() for an outline of the waveform
} 
David Sherman
  • 320
  • 2
  • 9
2

For a (hopefully) simple use and integration of a waveform with your app you might want to check what we are doing at IRCAM, specially the waveform-vis in this particular case.

It's all open source and aimed for modularity (and work in progress)

You can find a demo over here
And the corresponding githug repository

vectorsize
  • 1,005
  • 1
  • 7
  • 6
1

Here's a solution without any additional libraries that I implemented in my code after going through a number of other similar StackOverflow questions and blog posts. It's in TypeScript, but remove the types and you have vanilla JavaScript.

drawWaveForm(audioBuffer: AudioBuffer, canvas: HTMLCanvasElement) {
    const canvasWidth = Math.floor(canvas.clientWidth);
    const canvasHeight = Math.floor(canvas.clientHeight);
    canvas.width = canvasWidth;
    canvas.height = canvasHeight;
    const context: CanvasRenderingContext2D | null = canvas.getContext('2d');

    if (!context) return;

    const lineWidth = 1;
    const lineColor = '#ff67da';
    const nrOfLinesPerPixel = 8; // This is our resolution, tweak for performance vs accuracy
    const nrOfLines = (nrOfLinesPerPixel * canvasWidth) / lineWidth;
    const lineGap = canvasWidth / nrOfLines;

    const leftChannelData = audioBuffer.getChannelData(0); // Float32Array describing left channel
    const sizeOfABucket = Math.floor(leftChannelData.length / nrOfLines); // Nr of data points to calculate each line
    const nrOfBuckets = Math.floor(leftChannelData.length / sizeOfABucket);

    let drawData = new Float64Array(nrOfLines);
    let maxDataValue = -1e4;

    // Uncomment to see how your buckets change according to lineWidth and nrOfLinesPerPixel
    // console.log({
    //   lineWidth,
    //   nrOfLinesPerPixel,
    //   nrOfLines,
    //   lineGap,
    //   dataLength: leftChannelData.length,
    //   sizeOfABucket,
    //   nrOfBuckets,
    // });

    // Go through all buckets and calculate the mean value in each bucket. Thereafter normalize the data.
    //
    // Raw Data:     0.25 0.234 0.146 0.13 0.37   0.267 0.123 0.44 0.32 0.21  ...
    // Buckets:     └──────── Bucket 0 ────────┘ └──────── Bucket 1 ────────┘
    //                          │                            │
    // Mean:                  0.166                        0.272              ...
    //                          │                            │
    // Normalized:            0.49                         0.66               ...
    //
    for (let bucketIndex = 0; bucketIndex < nrOfBuckets; bucketIndex++) {
      for (let bucketDataIndex = 0; bucketDataIndex < sizeOfABucket; bucketDataIndex++) {
        const dataIndex = bucketIndex * sizeOfABucket + bucketDataIndex;
        // Add upp every value in the bucket
        drawData[bucketIndex] += Math.abs(leftChannelData[dataIndex]);

        // Save the greatest value
        if (leftChannelData[dataIndex] > maxDataValue) {
          maxDataValue = leftChannelData[dataIndex];
        }
      }

      // Get mean value of each bucket
      drawData[bucketIndex] /= sizeOfABucket;
    }

    // Because we have so much zero or near zero values in the audio data, the resulting averages of the data points are very small.
    // To make sure this visualization works for all audio files, we need to normalize the data.
    // Normalize the data --> change the scale of the data so that the loudest sample measure as maxDataValue.
    const multiplier = Math.pow(Math.max(...drawData), -maxDataValue);
    drawData = drawData.map((n) => n * multiplier);

    context.lineWidth = lineWidth;
    context.strokeStyle = lineColor;
    context.globalCompositeOperation = 'multiply'; // https://developer.mozilla.org/en-US/docs/Web/API/CanvasRenderingContext2D/globalCompositeOperation

    context.clearRect(0, 0, canvasWidth, canvasHeight);

    // Save current state of canvas before we translate, scale and draw, and restore once we're done
    context.save();

    // Draw in the vertical middle of the canvas and scale all values (-1 to 1) to fit the canvas height
    context.translate(0, canvasHeight / 2);
    context.scale(1, canvasHeight / 2);

    // Draw all our lines
    context.beginPath();
    for (let i = 0; i < drawData.length; i++) {
      const x = i * lineGap;
      const y = drawData[i];
      context.moveTo(x, y);
      context.lineTo(x, y * -1);
    }
    context.stroke();

    // Draw a line through the middle
    context.lineWidth = 0.5 / canvasHeight;
    context.beginPath();
    context.moveTo(0, 0);
    context.lineTo(canvasWidth, 0);
    context.stroke();

    context.restore();
  }

Drawn waveform