11

In a Java threaddump I found the following:

"TP-Processor184" daemon prio=10 tid=0x00007f2a7c056800 nid=0x47e7 waiting for monitor entry [0x00007f2a21278000]
   java.lang.Thread.State: BLOCKED (on object monitor)
    at org.apache.jackrabbit.core.state.SharedItemStateManager.getNonVirtualItemState(SharedItemStateManager.java:1725)
    - locked <0x0000000682f99d98> (a org.apache.jackrabbit.core.state.SharedItemStateManager)
    at org.apache.jackrabbit.core.state.SharedItemStateManager.getItemState(SharedItemStateManager.java:257)

"TP-Processor137" daemon prio=10 tid=0x00007f2a7c00f800 nid=0x4131 waiting for monitor entry [0x00007f2a1ace7000]
   java.lang.Thread.State: BLOCKED (on object monitor)
    at org.apache.jackrabbit.core.state.SharedItemStateManager.getNonVirtualItemState(SharedItemStateManager.java:1725)
    - locked <0x0000000682f99d98> (a org.apache.jackrabbit.core.state.SharedItemStateManager)
    at org.apache.jackrabbit.core.state.SharedItemStateManager.getItemState(SharedItemStateManager.java:257)

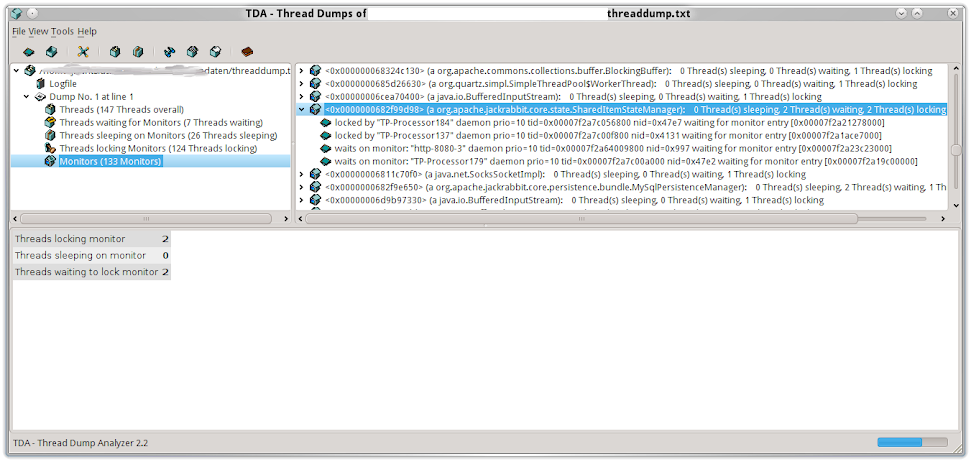
The point here being that both threads have locked monitor <0x0000000682f99d98> (regardless of them now waiting for two different other monitors).

When looking at Thread Dump Analyzer, with that monitor being selected, it really says "Threads locking monitor: 2" at the bottom, and "2 Thread(s) locking". Please see https://lh4.googleusercontent.com/-fCmlnohVqE0/T1D5lcPerZI/AAAAAAAAD2c/vAHcDiGOoMo/s971/locked_by_two_threads_3.png for the screenshot, I'm not allowed to paste images here.

Does this mean threaddumps aren't atomic with respect to monitor lock information? I can't imagine this really being a locking bug of the JVM (1.6.0_26-b03).

A similar question has already been asked in Can several threads hold a lock on the same monitor in Java?, but the answer to me didn't see the real point of multiple threads locking the same monitor, even though they may be waiting for some other.

Update May 13th 2014:

Newer question Multiple threads hold the same lock? has code to reproduce the behaviour, and @rsxg has filed an according bug report https://bugs.openjdk.java.net/browse/JDK-8036823 along the lines of his answer here.

Community
  • 1
  • 1
jfrantzius
  • 623
  • 7
  • 16
  • Any feedback on my answer dude? I edited it to point out that later versions of the code have a `wait()` on line 1725. Please accept if this is right. – Gray Mar 15 '12 at 21:26
  • We are using Jackrabbit version 1.6.5. A friend of mine also saw that `wait()` on the same line number in version 2.3.6, as it strikingly seems to match, but unfortunately that's the wrong sourcecode... – jfrantzius Mar 21 '12 at 09:21

4 Answers4

3

I don't think that your thread dump is saying that your two threads are "waiting for two different other monitors". I think it is saying that they are both waiting on the same monitor but at two different code points. That may be a stack location or an object instance location or something. This is a great document about analyzing the stack dumps.

Can several threads hold a lock on the same monitor in Java?

No. Your stack dump is showing two threads locked on the same monitor at the same code location but in different stack frames -- or whatever that value is which seems OS dependent.

Edit:

I'm not sure why the thread dump seems to be saying that both threads have a line locked since that seems to only be allowed if they are in a wait() method. I noticed that you are linking to version 1.6.5. Is that really the version you are using? In version 2.3.6 (which may be the latest), the 1725 line actually is a wait.

1722        synchronized (this) {
1723            while (currentlyLoading.contains(id)) {
1724                try {
1725                    wait();
1726                } catch (InterruptedException e) {

You could also see this sort of stack trace even if it was an exclusive synchronized lock. For example, the following stack dump under Linux is for two threads locked on the same object from the same code line but in two different instances of the Runnable.run() method. Here's my stupid little test program. Notice that the monitor entry numbers are different, even thought it is the same lock and same code line number.

"Thread-1" prio=10 tid=0x00002aab34055c00 nid=0x4874
  waiting for monitor entry [0x0000000041017000..0x0000000041017d90]
java.lang.Thread.State: BLOCKED (on object monitor)
    at java.lang.Object.wait(Native Method)
    - waiting on <0x00002aab072a1318> (a java.lang.Object)
    at com.mprew.be.service.auto.freecause.Foo$OurRunnable.run(Foo.java:38)
    - locked <0x00002aab072a1318> (a java.lang.Object)
    at java.lang.Thread.run(Thread.java:619)

"Thread-0" prio=10 tid=0x00002aab34054c00 nid=0x4873
  waiting for monitor entry [0x0000000040f16000..0x0000000040f16d10]
java.lang.Thread.State: BLOCKED (on object monitor)
    at java.lang.Object.wait(Native Method)
    - waiting on <0x00002aab072a1318> (a java.lang.Object)
    at com.mprew.be.service.auto.freecause.Foo$OurRunnable.run(Foo.java:38)
    - locked <0x00002aab072a1318> (a java.lang.Object)
    at java.lang.Thread.run(Thread.java:619)

On my Mac, the format is different but again the number after the "monitor entry" is not the same for the same line number.

"Thread-2" prio=5 tid=7f8b9c00d000 nid=0x109622000
  waiting for monitor entry [109621000]
java.lang.Thread.State: BLOCKED (on object monitor)
    at java.lang.Object.wait(Native Method)
    - waiting on <7f3192fb0> (a java.lang.Object)
    at com.mprew.be.service.auto.freecause.Foo$OurRunnable.run(Foo.java:38)
    - locked <7f3192fb0> (a java.lang.Object)

"Thread-1" prio=5 tid=7f8b9f80d800 nid=0x10951f000
  waiting for monitor entry [10951e000]
java.lang.Thread.State: BLOCKED (on object monitor)
    at java.lang.Object.wait(Native Method)
    - waiting on <7f3192fb0> (a java.lang.Object)
    at com.mprew.be.service.auto.freecause.Foo$OurRunnable.run(Foo.java:38)
    - locked <7f3192fb0> (a java.lang.Object)

This Oracle document describe that value as the following:

Address range, which gives an estimate of the valid stack region for the thread

rxg
  • 3,777
  • 22
  • 42
Gray
  • 115,027
  • 24
  • 293
  • 354
  • Interesting stuff! I'd always assumed the numbers for monitors were addresses of the locked objects, but evidently not. It probably wouldn't be *that* hard to dig into the JVM source code to find the place where these traces are constructed, and see where those numbers come from. I have to confess i don't feel like doing it right this minute, though. – Tom Anderson Mar 02 '12 at 21:22
  • Thanks for that test! The two threads in the dump are wait()ing for the same object that they had locked before, though, so they both have actually released the lock. That's an example of how two "locked" events can be shown in a threaddump for two different threads for the same monitor, but still different from my thread dump. The threads there do not wait() and did not release the locks (on the same monitor) they both seem to have obtained, and that's against the JVM spec. You're right about my misinterpretation of the "monitor entry" address, only Sun seems to know exactly what it means... – jfrantzius Mar 02 '12 at 21:48
  • I disagree @jfrantzius. I think your stack trace is the same. The threads have locked the same lock (0x0000000682f99d98) and have waited for it. Since they are now `BLOCKED` I think this means that they have stopped waiting -- either from being notified or wait timeout. If you run my little test program and twiddle the timeouts you can see the threads move from waiting to blocked. – Gray Mar 02 '12 at 21:57
  • @Gray there is no wait() in the [sourcecode](http://grepcode.com/file/repo1.maven.org/maven2/org.apache.jackrabbit/jackrabbit-core/1.6.5/org/apache/jackrabbit/core/state/SharedItemStateManager.java#1725) as there is in yours. There is a synchronized block only. – jfrantzius Mar 02 '12 at 21:59
  • Ignoring that contradiction of the JVM spec, the next question is: what the hell are the threads waiting for then? [Oracle Forum](https://forums.oracle.com/forums/thread.jspa?threadID=2238488) suggests it's the Garbage Collection putting threads in BLOCKED state, as does [this Stack Overflow question](http://stackoverflow.com/questions/4016356/java-blocking-issue-why-would-jvm-block-threads-in-many-different-classes-metho). But that's just guessing at the moment. – jfrantzius Mar 02 '12 at 22:09
  • So @jfrantzius, the lock looks to be `readLock = acquireReadLock(id);` on line 253. I've updated my answer with the details of that lock. The type of lock it is hidden by an interface. I'm impressed that shared locks show up in the stack trace like that. – Gray Mar 03 '12 at 16:08
  • @Gray the locks reported by a thread dump are JVM-level object monitors, and can only be acquired by entering a synchronized block or method. Once such a block or method is left, the lock is released. So a call to a method such as "acquireReadLock()", once it has returned, cannot leave a locked object monitor, simply because the method isn't on the call stack anymore. The call may leave changes to other object state, but not object monitors. – jfrantzius Mar 06 '12 at 08:48
  • Yeah @jfrantzius, you are right. I removed the readlock edit. That wasn't it. I just took a longer look at your code. I bet you are not running version 1.6.5 of your code. Line 1725 in version 2.3.6 actually _is_ a `wait` line. See: http://grepcode.com/file/repo1.maven.org/maven2/org.apache.jackrabbit/jackrabbit-core/2.3.6/org/apache/jackrabbit/core/state/SharedItemStateManager.java/#1725 – Gray Mar 06 '12 at 14:15
  • @Gray, We are also facing similar issues. I tried to post details as a comment here, but it's too long. So, I have posted as a new answer. Please let us know your thoughts. – Arnab Biswas Jul 03 '13 at 14:13
  • Added it as a new question @ http://stackoverflow.com/questions/17464152/multiple-threads-acquiring-the-same-monitor/17464272?noredirect=1#17464272 – Arnab Biswas Jul 04 '13 at 07:44
2

You are probably running into a cosmetic bug in the stack trace routines in the JVM when analyzing heavily contended locks - it may or may not be the same as this bug.

The fact is that neither of your two threads have actually managed to acquire the lock on the SharedItemStateManager, as you can see from the fact that they are reporting waiting for monitor entry. The bug is that further up in the stack trace in both cases they should report waiting to lock instead of locked.

The workaround when analyzing strange stack traces like this is to always check that a thread claiming to have locked an object is not also waiting to acquire a lock on the same object.

(Unfortunately this analysis requires cross-referencing the line numbers in the stack trace with the source, code since there is no relationship between the figures in the waiting for monitor entry header and the locked line in the stack trace. As per this Oracle document, the number 0x00007f2a21278000 in the line TP-Processor184" daemon prio=10 tid=0x00007f2a7c056800 nid=0x47e7 waiting for monitor entry [0x00007f2a21278000] refers to an estimate of the valid stack region for the thread. So it looks like a monitor ID but it isn't - and you can see that the two threads you gave are at different addresses in the stack).

rxg
  • 3,777
  • 22
  • 42
  • A cosmetic bug in the stack trace routines sounds sensible, and I'd feel much better about it than monitors not being exclusive :) Concerning your workaround (for deciding what's going on), the two threads didn't lock the same object (`<0x0000000682f99d98>`) that they are waiting to acquire a lock on (`[0x00007f2a21278000]`)? – jfrantzius Mar 06 '14 at 09:10
  • Unfortunately it is not clear what the hex string after 'monitor entry' refers to, as in the answer from Gray and the associated comments. I always ignore it when analysing stack traces. – rxg Mar 06 '14 at 11:32
  • @jfrantzius Oracle have released documentation clarifying the meaning of the different fields in the thread dump header, I updated my answer. – rxg May 13 '14 at 10:44
2

When a thread locks an object but wait()s another thread can lock the same object. You should be able to see a number of threads "holding" the same lock all waiting.

AFAIK, the only other occasion is when multiple threads have locked and waited and are ready to re-acquire the the lock e.g. on a notifyAll(). They are not waiting any more but cannot continue until they have obtained the lock again. (only one thread at a time time can do this)

Peter Lawrey
  • 525,659
  • 79
  • 751
  • 1,130
  • Just to clarify @Peter, You mean: "When a thread locks an object but wait()s _on_that_same_object_ another thread..." – Gray Mar 02 '12 at 19:28
  • @Peter: exactly, and the threads are *not* waiting on the same object, but on two different ones (if those hexadecimal number mean memory addresses of objects, that is...) – jfrantzius Mar 02 '12 at 21:14
  • OK, they are still not wait()ing on the same object, but they are waiting for *something* (maybe GC)... Anyway, they did not release the lock by calling wait(), but they seem to have both entered "synchronized (this)" for the same object "this". – jfrantzius Mar 02 '12 at 22:33
0
"http-0.0.0.0-8080-96" daemon prio=10 tid=0x00002abc000a8800 nid=0x3bc4 waiting for monitor entry [0x0000000050823000]
    java.lang.Thread.State: BLOCKED (on object monitor)
    at org.apache.lucene.search.FieldCacheImpl$Cache.get(FieldCacheImpl.java:195)
    - locked <0x00002aadae12c048> (a java.util.WeakHashMap)

"http-0.0.0.0-8080-289" daemon prio=10 tid=0x00002abc00376800 nid=0x2688 waiting for monitor entry [0x000000005c8e3000]
    java.lang.Thread.State: BLOCKED (on object monitor)
    at org.apache.lucene.search.FieldCacheImpl$Cache.get(FieldCacheImpl.java:195)
    - locked <0x00002aadae12c048> (a java.util.WeakHashMap

"http-0.0.0.0-8080-295" daemon prio=10 tid=0x00002abc00382800 nid=0x268e runnable [0x000000005cee9000]
     java.lang.Thread.State: RUNNABLE
     at org.apache.lucene.search.FieldCacheImpl$Cache.get(FieldCacheImpl.java:195)
     - locked <0x00002aadae12c048> (a java.util.WeakHashMap)

In our thread dump, we have several threads lock same monitor, but only one thread is runnable. It probably because of lock competition, we have 284 other threads waiting for the lock. Multiple threads hold the same lock? said this only exists in the thread dump, for thread dump is not atomic operation.

Community
  • 1
  • 1
leef
  • 593
  • 8
  • 12