could you tell me if it is possible make a bar plot with bar height normalized to 1, but bar width proportional to the number of elements in each bin.
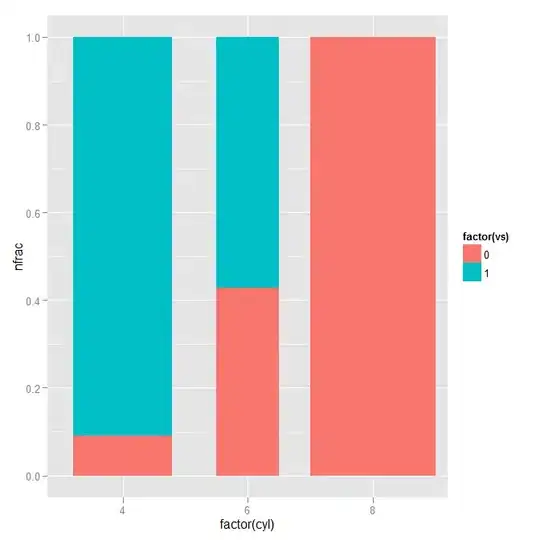
Example : this plot
ggplot(mtcars, aes(x=factor(cyl), fill=factor(vs))) + geom_bar(position="fill")
and then make the width of the 3 bars proportional to
table(factor(mtcars$cyl))
There is well that "width" parameter in position_fill() but it has to be a constant, hasn't it ?
Thank you,
François
EDIT :
I tried a bit further, and get the message : "position_fill requires constant width"
So I guess to get what I tried to get is impossible, at least using geom_bar.